Has there been an epidemic of police killing black people in the United States recently? Does the number of these deaths have anything to do with the crime rate in the black community? And what does the death of George Floyd have to do with white people kneeling recently? Larry Elder takes a closer look at these topics.
This is Larry at his best. He refutes the mantras sprouting up again by the angry Left and the MSM.
After the Ahmaud Arbery shooting, LeBron James said Black people are “literally hunted” every day they go outside. Larry decides to look at the statistics to find out how dangerous it really is for Black people when it comes to violence in the community.
“I don’t know where Ice Cube lives, but he doesn’t live in the hood…” Larry responds to Ice Cube’s Tweet which appears to incite violence toward the police
With the Democratic Party presidential campaigns going full steam, a number of candidates have argued that systemic racism has infected America since its foundation. Larry takes a look at former President Obama and his transition from saying that race wasn’t important to fully embracing identity politics. Larry also looks further into how disadvantaged Black Americans truly are and finds some interesting information.
Systemic Racism in Modern America? Larry Elder makes the case for the exact opposite. Listen to the full segment here.
Larry Interviews Heather Mac Donald of the Manhattan Institute.
After a caller leaves a message mentioning the 72-police officers being put on leave for “racist” comments on their social media sites, Larry Elder brings some rational stats into the conversation. Let me also say, all I have read so far is that these offices said some racist, Islamophobic, and disparaging comments. I bet a good amount of these comments were stuff the PC-Police “think” are these things, but are are not. See Larry’s article entitled, “Criminal Behavior, Not Racism, Explains ‘Racial Disparities’ in Crime Stats“.
Larry Elder has predicted this for years! With police officers in the eye of the political correctness storm, these police are obviously protecting themselves by “playing it safe.” What is known as “passive policing.” In the neighborhoods where this is happening, there have been crowds disrupting police arrests, lawsuits threatened, and criminal charges against police have been promised. So rather than endure a career ending move, they are circling the wagons. Rightly so.
This consequence is WHOLLY lain at the feet of Democrats. 100%
“The real racial bias: Cops more willing to shoot whites than blacks, research finds” (WASHINGTON TIMES)
Here are the first couple segments of Larry’s show… where he uses stats and facts (from the newest study as well in the NYTS ARTICLE by the Harvard economist to LAY-DOWN-THE-LAW about blacks being shot by officers. Enjoy!
An interesting article can be found here on the shooting by the Saint Anthony, MN, Police Office (AMERICAN SPECTATOR)
Here is LARRY ELDER setting the record straight with stats:
…Let’s start with 2014, the last year for which there are official records. According to the Centers for Disease Control, the police killed 261 whites and 131 blacks. The CDC also found that from 1999 to 2013, the police killed almost twice the number of whites compared to blacks, 3,160 and 1,724, respectively.
Activists promptly note that whites account for nearly 65 percent of the population and that, therefore, one would expect whites to comprise most of those killed by cops. And we are told that blacks, while 13 percent of the population, represent a much greater percentage of those killed by cops. Institutional, systemic, structural racism!
Here’s what those promoting the “police disproportionately kill black people” narrative consistently omit. Whites, despite being almost 65 percent of the population, disproportionately commit less of the nation’s violent crime – 10 percent. Blacks, at 13 percent of the population, disproportionately commit more violent crime. As to murders, black commit nearly half. Yet whites are 50 percent of cop killings.
Criminology professor Peter Moskos looked at the numbers of those killed by officers from May 2013 to April 2015 and found that 49 percent were white, while 30 percent were black. “Adjusted for the homicide rate,” says Moskos, “whites are 1.7 times more likely than blacks to die at the hands of police.” So if anything, whites have more to complain about than Mr. Williams….
[Dr. Robert Levin, Health Officer and Medical Director, Ventura County] He predicted 400-to-600 hospitalizations a day. He revised that to 200-to-400 a day…. we are barely over 200 for the ENTIRE ordeal…. We now have a panic over 51 total hospitalizations in a county with eight hospitals. Can you people do math? Can you PLEASE do basic math. This is not a crisis, you however, have created one. You, in an effort to try and prevent all deaths (we’ve had 43 deaths) you have ended all relevant life…. (See more at JOHN ZIEGLER’S site)
STANFORD has released a new paper where they look at their own studies as well as “23 studies with a sample size of at least 500 have been published either in the peerreviewed literature or as preprints as of June 7, 2020.” In this they find confirmation to strongly say:
…In the paper, which has not yet been peer-reviewed, Ioannidis surveyed 23 different seroprevalence studies and found that “among people <70 years old, infection fatality rates ranged from… 0.00-0.23% with median of 0.04%.”
The median fatality rate of all cases, he writes, is 0.26%, significantly lower than some earlier estimates that suggested rates as high as over 3%.
In the paper, Ioannidis acknowledges that “while COVID-19 is a formidable threat,” the apparently low fatality rate compared to earlier estimates “is a welcome piece of evidence.”
“Decision-makers can use measures that will try to avert having the virus infect people and settings who are at high risk of severe outcomes,” he writes. “These measures may be possible to be far more precise and tailored to specific high- risk individuals and settings than blind lockdown of the entire society.”
Keep in mind in March I noted that the rates would be from 0.03% to 0.25% — not to brag or anything, but I am in the 23-studies lane-lines. I just couldn’t differentiate between age groups, but that was assumed as the average age of deaths.
And as states are going over death certificates, they are dropping by at least 25% in deaths by Covid-19. And some independent groups are helping “catch” the inflated number, like Pennsylvania’s “Wolf administration was caught this week adding up to 269 fake deaths to the state totals on Tuesday” (CITADELPOLITICS). Or this short example (PJ-MEDIA)
On Thursday, the Washington State Department of Health (DOH) confirmed a report by the Freedom Foundation that they have included those who tested positive for COVID-19 but died of other causes, including gunshot injuries, in their coronavirus death totals. This calls into serious question the state’s calculations of residents who have actually died of the CCP pandemic.
Last week, after it was reported that, like Washington, Colorado was counting deaths of all COVID-19 positive persons regardless of cause (which had resulted in the inclusion of deaths from alcohol poisoning), the Colorado Department of Health and Environment began to differentiate between deaths “among people with COVID-19” and “deaths due to COVID-19.”
Just one more of the many examples I could share is the New York Times getting 40% wrong of their “died from Covid-19 under 30-years old” front page news story. Mmmm, no, they didn’t die of Covid. As states figure this out, the inflated counts (like when Colorado did this — fell by 25%: lots more on this below).
CONTRACTED TWICE?
In a recent conversation two items came up that are worth updating for friends and family. The first deals with if a person can get the WuFlu twice. FORBES has a good article on this:
…Whenever I lecture on the Covid-19 outbreak, someone always asks me, “Can I get infected twice?” This is a natural concern. After all, if someone suffers through the prolonged fever, hacking cough, and profound weakness and misery caused by the virus, one small positive aspect might be not having to suffer through it a second time.
Such fears were ratcheted up after there were reports in Korea about people who had recovered from illness and tested negative, only to have a later test come up positive again. This prompted fear of new spread, even from recovered victims. Back in early March, a mayor in Texas, blasted the CDC for releasing a recovered patient from isolation, only to have that patient test positive again after release.
As a health care provider, the last thing you want to do is tell someone they are cured and release them back into the community, only to learn later that they started a whole new chain of virus transmission. Fortunately, a new study from the South Korean Center for Disease Control helps to answer part of the question. They studied patients who tested negative upon recovery, but in later tests became positive again. Could they spread the virus again?
It turns out, despite the positive test, they found that none of them were secreting live, infectious virus. It was a quirk of the rapid tests, which sample for low levels of genetic material, not whole virus. They concluded that the recovered patients had residual genetic fragments that still triggered the tests to turn positive. Those individuals were no longer contagious.
This was a relief. In other good news, a new draft paper reports that monkeys that were infected with the SARS-CoV-2 virus developed antibodies and were protected from illness when exposed to the virus a second time. It’s a small study, but it offers a glimmer of hope that once infected, there is immunity to re-infection….
The second issue was regarding animals being able to contract the virus.
Q: Could I infect my pets with coronavirus, or vice versa? Can someone get infected by touching an animal’s fur? Should I get my pet tested for coronavirus?
Most of those infections came from contact with people who had coronavirus, like a zoo employee who was an asymptomatic carrier.
But according to the CDC, there is no evidence animals play a significant role in spreading the virus to humans. Therefore, at this time, routine testing of animals for Covid-19 is not recommended.
As always, it’s best to wash your hands after touching an animal’s fur and before touching your face. And if your pet appears to be sick, call your veterinarian.
More “known” examples from the CDC:
A small number of pet cats and dogs have been reported to be infected with the virus in several countries, including the United States. Most of these pets became sick after contact with people with COVID-19.
Several lions and tigersexternal icon at a New York zoo tested positive for SARS-CoV-2 after showing signs of respiratory illness. Public health officials believe these large cats became sick after being exposed to a zoo employee who was infected with SARS-CoV-2. All of these large cats have fully recovered.
SARS-CoV-2 was recently discovered in mink (which are closely related to ferrets) on multiple farms in the Netherlands. The mink showed respiratory and gastrointestinal signs; the farms also experienced an increase in mink deaths. Because some workers on these farms had symptoms of COVID-19, it is likely that infected farm workers were the source of the mink infections. Some farm cats on several mink farms also developed antibodies to this virus, suggesting they had been exposed to the virus at some point. Officials in the Netherlands are investigating the connections between the health of people and animals as well as the environment on these mink farms.
(The below is from June 19th)
COMPARED
MAROON numbers are death rate, and the BLUE numbers are hospitalization rates. Rated by placement as well. This is merely for comparison to decide if $1.1 trillion lost for every month of the economic shutdown and the long-term damage on the U.S. economy, shrinking it by $7.9 trillion over the next decade.
[1]The 1918-19 “Spanish Flu” Pandemic — 675,000 died in the United States, some victims died within mere hours or days of developing symptoms.
[2]The 1957-58 “Asian Flu” Pandemic — 116,000 deaths were in the US. Most of the cases affected young children.
[3]The 1968 “Hong Kong Flu” Pandemic—100,000 deaths occurred in the United States
[12](9) The 2009 H1N1 Pandemic— About 80% of those deaths are believed to have been people younger than 65 — which is unusual. During typical seasonal influenza epidemics, 70-90% of deaths occur in people over 65. 274,000 hospitalizations, and 12,469 deaths in the United States due to the virus.
[9](7)2010-2011 flu season— 290,000 influenza-related hospitalizations and 37,000 flu-associated deaths
[6](3)2012-2013 flu season — 56,000 deaths is the CDC estimate. 571,000 influenza-related hospitalizations
[8](6)2013-2014 flu season — 347,000 influenza-related hospitalizations, and 38,000 flu-associated deaths
[7](2)2014-2015 flu season— 591,000 influenza-related hospitalizations, and 51,000 flu-associated deaths
[11](8)2015-2016 flu season— 280,000 influenza-related hospitalizations, and 23,000 flu-associated deaths
[8](4)2016-2017 flu season— 500,000 influenza-related hospitalizations, and 38,000 influenza-associated deaths
[5](1)2017-2018 flu season — The CDC estimates that between 46,000 and 95,000 Americans died due to influenza during the 2017-18 flu season. This resulted in an estimated 959,000 hospitalizationsand a middle-ground of 61,099 deaths.
[10](5)2018-2019 flu season — 490,600 hospitalizations, and 34,200 deaths from influenza
[4](10)Covid-19 (SARS-CoV-2) — With the adjusted numbers that I believe the flu (a bad influenza season assumed to be novel influenza on untested patients), I would bet we are at about 80,000 or less deaths from The WuFlu. US Coronavirus Hospitalizations is at a current level of 229,212.
Steven Crowder takes to the streets of Dallas to have real conversations with real people. In this installment, Steven discusses the COVID19 death count and the fake news surrounding it.
Crowder is posted above as an UPDATE to support my contention below:
(The below is from May 24th, 2020)
Here are some updated numbers, from CONSERVATIVE REVIEW — and I will post a portion of an older post [recently updated] underneath this (also, if the graphics are not linked to ENLARGE, I will linkto the Twitter accounts associated with the graphics):
The CDC just came out with a report that should be earth-shattering to the narrative of the political class, yet it will go into the thick pile of vital data and information about the virus that is not getting out to the public. For the first time, the CDC has attempted to offer a real estimate of the overall death rate for COVID-19, and under its most likely scenario, the number is 0.26%. Officials estimate a 0.4% fatality rate among those who are symptomatic and project a 35% rate of asymptomatic cases among those infected*jump, which drops the overall infection fatality rate (IFR) to just 0.26% — almost exactly where Stanford researchers pegged it a month ago.
Until now, we have been ridiculed for thinking the death rate was that low, as opposed to the 3.4% estimate of the World Health Organization, which helped drive the panic and the lockdowns. Now the CDC is agreeing to the lower rate in plain ink.
Plus, ultimately we might find out that the IFR is even lower because numerous studies and hard counts of confined populations have shown a much higher percentage of asymptomatic cases. Simply adjusting for a 50% asymptomatic rate would drop their fatality rate to 0.2% – exactly the rate of fatality Dr. John Ionnidis of Stanford University projected.
More importantly, as I mentioned before, the overall death rate is meaningless because the numbers are so lopsided. Given that at least half of the deaths were in nursing homes, a back-of-the-envelope estimate would show that the infection fatality rate for non-nursing home residents would only be 0.1% or 1 in 1,000. And that includes people of all ages and all health statuses outside of nursing homes. Since nearly all of the deaths are those with comorbidities.
The CDC estimates the death rate from COVID-19 for those under 50 is 1 in 5,000 for those with symptoms, which would be 1 in 6,725 overall, but again, almost all those who die have specific comorbidities or underlying conditions. Those without them are more likely to die in a car accident. And schoolchildren, whose lives, mental health, and education we are destroying, are more likely to get struck by lightning.
[….]
To put this in perspective, one Twitter commentator juxtaposed the age-separated infection fatality rates in Spain to the average yearly probability of dying of anything for the same age groups, based on data from the Social Security Administration. He used Spain because we don’t have a detailed infection fatality rate estimate for each age group from any survey in the U.S. However, we know that Spain fared worse than almost every other country. This data is actually working with a top-line IFR of 1%, roughly four times what the CDC estimates for the U.S., so if anything, the corresponding numbers for the U.S. will be lower.
I wanted to expand the Twitter graphic and link above a bit, I spent some time going through the comments and many of the conversational offshoots. I figured this collection (ending with my comment) sums up the issue in a lot less time:
(Click once to get large graphic, click again to blow it up)
There is a fascinating “official” continuation of this convo with more detail (linked in below Twitter graphic):
…as well as all the Facebook discussions/debates between myself, friends, family, and complete strangers.
...AND,
…as I show below, this number will get lower upon investigation of common sense assumptions if never investigated.
REASON has their article discussing the issue of IFR and America compared to Europe (see also BLOOMBERG’S article):
According to the Centers for Disease Control and Prevention (CDC), the current “best estimate” for the fatality rate among Americans with COVID-19 symptoms is 0.4 percent. The CDC also estimates that 35 percent of people infected by the COVID-19 virus never develop symptoms. Those numbers imply that the virus kills less than 0.3 percent of people infected by it—far lower than the infection fatality rates (IFRs) assumed by the alarming projections that drove the initial government response to the epidemic, including broad business closure and stay-at-home orders.
The CDC offers the new estimates in its “COVID-19 Pandemic Planning Scenarios,” which are meant to guide hospital administrators in “assessing resource needs” and help policy makers “evaluate the potential effects of different community mitigation strategies.” It says “the planning scenarios are being used by mathematical modelers throughout the Federal government.”
The CDC’s five scenarios include one based on “a current best estimate about viral transmission and disease severity in the United States.” That scenario assumes a “basic reproduction number” of 2.5, meaning the average carrier can be expected to infect that number of people in a population with no immunity. It assumes an overall symptomatic case fatality rate (CFR) of 0.4 percent, roughly four times the estimated CFR for the seasonal flu. The CDC estimates that the CFR for COVID-19 falls to 0.05 percent among people younger than 50 and rises to 1.3 percent among people 65 and older. For people in the middle (ages 50–64), the estimated CFR is 0.2 percent.
That “best estimate” scenario also assumes that 35 percent of infections are asymptomatic, meaning the total number of infections is more than 50 percent larger than the number of symptomatic cases. It therefore implies that the IFR is between 0.2 percent and 0.3 percent. By contrast, the projections that the CDC made in March, which predicted that as many as 1.7 million Americans could die from COVID-19 without intervention, assumed an IFR of 0.8 percent. Around the same time, researchers at Imperial College produced a worst-case scenario in which 2.2 million Americans died, based on an IFR of 0.9 percent.
Such projections had a profound impact on policy makers in the United States and around the world. At the end of March, President Donald Trump, who has alternated between minimizing and exaggerating the threat posed by COVID-19, warned that the United States could see “up to 2.2 million deaths and maybe even beyond that” without aggressive control measures, including lockdowns.
One glaring problem with those worst-case scenarios was the counterfactual assumption that people would carry on as usual in the face of the pandemic—that they would not take voluntary precautions such as avoiding crowds, minimizing social contact, working from home, wearing masks, and paying extra attention to hygiene. The Imperial College projection was based on “the (unlikely) absence of any control measures or spontaneous changes in individual behaviour.” Similarly, the projection of as many as 2.2 million deaths in the United States cited by the White House was based on “no intervention”—not just no lockdowns, but no response of any kind.
Another problem with those projections, assuming that the CDC’s current “best estimate” is in the right ballpark, was that the IFRs they assumed were far too high. The difference between an IFR of 0.8 to 0.9 percent and an IFR of 0.2 to 0.3 percent, even in the completely unrealistic worst-case scenarios, is the difference between millions and hundreds of thousands of deaths—still a grim outcome, but not nearly as bad as the horrifying projections cited by politicians to justify the sweeping restrictions they imposed.
“The parameter values in each scenario will be updated and augmented over time, as we learn more about the epidemiology of COVID-19,” the CDC cautions. “New data on COVID-19 is available daily; information about its biological and epidemiological characteristics remain[s] limited, and uncertainty remains around nearly all parameter values.” But the CDC’s current best estimates are surely better grounded than the numbers it was using two months ago.
A recent review of 13 studies that calculated IFRs in various countries found a wide range of estimates, from 0.05 percent in Iceland to 1.3 percent in Northern Italy and among the passengers and crew of the Diamond Princess cruise ship. This month Stanford epidemiologist John Ioannidis, who has long been skeptical of high IFR estimates for COVID-19, looked specifically at published studies that sought to estimate the prevalence of infection by testing people for antibodies to the virus that causes the disease. He found that the IFRs implied by 12 studies ranged from 0.02 percent to 0.4 percent. My colleague Ron Bailey last week noted several recent antibody studies that implied considerably higher IFRs, ranging from 0.6 percent in Norway to more than 1 percent in Spain.
Methodological issues, including sample bias and the accuracy of the antibody tests, probably explain some of this variation. But it is also likely that actual IFRs vary from one place to another, both internationally and within countries. “It should be appreciated that IFR is not a fixed physical constant,” Ioannidis writes, “and it can vary substantially across locations, depending on the population structure, the case-mix of infected and deceased individuals and other, local factors.”
[….]
If you focus on hard-hit areas such as New York and New Jersey, an IFR between 0.2 and 0.3 percent, as suggested by the CDC’s current best estimate, seems improbably low. “While most of these numbers are reasonable, the mortality rates shade far too low,” University of Washington biologist Carl Bergstrom told CNN. “Estimates of the numbers infected in places like NYC are way out of line with these estimates.”
But the CDC’s estimate looks more reasonable when compared to the results of antibody studies in Miami-Dade County, Santa Clara County, Los Angeles County, and Boise, Idaho—places that so far have had markedly different experiences with COVID-19. We need to consider the likelihood that these divergent results reflect not just methodological issues but actual differences in the epidemic’s impact—differences that can help inform the policies for dealing with it.
IMMUNITIES
Of course there is another twist in the whole story morning glory… even with the vaccine, the virus itself is disappearing naturally as more and more people are naturally getting immune to it through contact (most react with no or minor symptoms), the vaccine will be useless by the time it is produced. (Which is why they will in the end FORCE this on us, to vindicate the monies spent and a need to recoup costs.)
Coronavirus ‘disappearing’ so fast Oxford vaccine has ‘only 50% chance of working’ https://t.co/xui1D4MpPL
This is because the HERD IMMUNITY rate may be much lower that some have been saying:
Why Herd Immunity To Covid-19 Is Reached Much Earlier Than Thought (JUDITH CURRY)
… In my view, the true herd immunity threshold probably lies somewhere between the 7% and 24% implied by the cases illustrated in Figures 4 and 5. If it were around 17%, which evidence from Stockholm County suggests the resulting fatalities from infections prior to the HIT being reached should be a very low proportion of the population. The Stockholm infection fatality rate appears to be approximately 0.4%,[20] considerably lower than per the Verity et al.[21] estimates used in Ferguson20, with a fatality rate of under 0.1% from infections until the HIT was reached. The fatality rate to reach the HIT in less densely populated areas should be lower, because R0 is positively related to population density.[22] Accordingly, total fatalities should be well under 0.1% of the population by the time herd immunity is achieved. Although there would be subsequent further fatalities, as the epidemic shrinks it should be increasingly practicable to hasten its end by using testing and contact tracing to prevent infections spreading, and thus substantially reduce the number of further fatalities below those projected by the SEIR model in a totally unmitigated scenario.
Herd Immunity May Only Need 10-20 Per Cent Of People To Be Infected (SPECTATOR UK)
…The usual health warnings apply. Gomes’ work is theoretical modelling and, in common with a lot of material on Covid-19 that is being pre-published at the moment (including Ferguson’s paper of 16 March), it has not been peer-reviewed. But it is interesting that it gives an estimate for herd immunity of between 10 and 20 per cent, because that echoes real-life experience. The closest we have to a controlled experiment on the spread of Covid-19 was the cruise ship Diamond Princess, where the disease was able to spread uncontrolled in January, and almost all were later tested for the disease. Out of the 3,711 passengers and crew, 712 – or 19 per cent – were infected.
If herd immunity really is achieved at between 10 to 20 per cent it could mean that many parts of the world are approaching it – or are there already. A study of 1,000 residents in the North West German town of Gangelt in early April suggested that 14 per cent had already been infected (many without even knowing it). A study of 1,300 New Yorkers in late April suggested that 21 per cent have been infected.
* I also believe the CDC to be waay off in their assessment of the asymptomatic expressions of this virus. They say it is 35%, I say this is way too low. I would posit the lowest is 50%, whereas the highest is between 80% and 86%. My guess is closer to 80%. Here are some examples to support my statements:
[/color-box]
When an outbreak of coronavirus in a Boston homeless shelter prompted officials to do more testing, the results caught them off guard. Of the 146 people who tested positive, all of them were considered asymptomatic.
“These are larger numbers than we ever anticipated,” said Dr. Jim O’Connell, president of the Boston Health Care for the Homeless Program. “Asymptomatic spread is something we’ve underestimated overall, and it’s going to make a big difference.”…
…Dr. Michael Para with OSU said the mass testing was a critical step.
“A large number were positive, but what is amazing is how many people were positive and had no symptoms at all. They were feeling fine,” he said. Mass testing at the Marion Correctional Institution, for example, revealed that approximately 96 percent of inmates who tested positive for COVID-19 were asymptomatic, Chambers-Smith added.
Para said clinicians looked at what they had found and they are now testing the people who were negative to see if they have turned positive.
“Going forward we are going to test specific individuals who are showing symptoms, who are being released, etc.,” he said. “By testing inmates on release, we can notify local health departments whether or not a person is COVID-19 positive.”…
Here, the NEW YORK POST (March 17, 2020) notes the journal article by saying:
“Stealth” coronavirus cases are fueling the pandemic, with a staggering 86% of people infected walking around undetected, a new study says.
Six of every seven cases – 86% — were not reported in China before travel restrictions were implemented, driving the spread of the virus, according to a study Monday in the journal Science.
“It’s the undocumented infections which are driving the spread of the outbreak,” said co-author Jeffrey Shaman of Columbia University Mailman School, according to GeekWire.
Using computer modeling, researchers tracked infections before and after the Chinese city of Wuhan’s travel ban.
The findings indicated that these undocumented infections with no or mild symptoms — known as “stealth” cases — were behind two-thirds of the reported patients.
“The majority of these infections are mild, with few symptoms at all,” Shaman said, Mercury News reported. “People may not recognize it. Or they think they have a cold.”…
This information likewise calls into question the “official numbers of deaths” being attributed to the CDC as well as supporting the idea that many more persons have the WU FLU, making the death rate percentages even smaller than being discussed above. I am repeating the below because I think it is crucially important!
Enjoy:
other PERTINENT information
MAY I ALSO NOTE that I believe the deaths from The Rona are a bit overstated, while Dr. Birx noted that the CDC may be inflating the death toll by 25%, I provide a couple other examples to support my claim.
UPDATED INFO – Real Quick
On Thursday, the Washington State Department of Health (DOH) confirmed a report by the Freedom Foundation that they have included those who tested positive for COVID-19 but died of other causes, including gunshot injuries, in their coronavirus death totals. This calls into serious question the state’s calculations of residents who have actually died of the CCP pandemic.
First up, Dr. Birx setting the stage for this with how deaths are coded:
Another example comes from Dr. Ngozi, Director of public health Illinois. She explains how ALL deaths are counted as Covid-19 even if the patient was diagnosed to have die from another disease:
Adapted from the above video description is important (via 4 TIMES A YEAR)
“Should “COVID-19” be reported on the death certificate only with a confirmed test? COVID-19 should be reported on the death certificate for all decedents where the disease caused or is assumed to have caused or contributed to death.” (CDC): “Deborah Birx, a physician who’s leading the White House’s coronavirus task force, said Alabama’s strategy conflicts with CDC’s approach to tallying Covid-19-realted deaths. “[W]e’ve taken a very liberal approach to mortality,” she said. “[I]f someone dies with Covid-19, we are counting that as a Covid-19 death.” (ADVISORY)
As many have pointed out, there is a big difference between dying WITH the virus and FROM the virus.
Note Dr. Birx’s similar wording to what Italy was doing:
“‘We’ve taken a very liberal approach to mortality….” “The way in which we code deaths in our country is very generous in the sense that all the people who die in hospitals with the coronavirus are deemed to be dying of the coronavirus.”
Italy, unlike the CDC, corrected its error:
“The age of our patients in hospitals is substantially older – the median is 67, while in China it was 46,” Prof Ricciardi says. “So essentially the age distribution of our patients is squeezed to an older age and this is substantial in increasing the lethality.”
A study in JAMA this week found that almost 40 per cent of infections and 87 per cent of deaths in the country have been in patients over 70 years old.
[….]
But Prof Ricciardi added that Italy’s death rate may also appear high because of how doctors record fatalities.
“The way in which we code deaths in our country is very generous in the sense that all the people who die in hospitals with the coronavirus are deemed to be dying of the coronavirus.
“On re-evaluation by the National Institute of Health, only 12 per cent of death certificates have shown a direct causality from coronavirus, while 88 per cent of patients who have died have at least one pre-morbidity – many had two or three,” he says.
[….]
If further testing finds more asymptomatic cases spreading undetected, the mortality rate will drop.
1) The shocking inflation of COVID-19 death numbers: From day one, we were warned that states are ascribing every single death of anyone who happens to test positive for the coronavirus — even if they are asymptomatic — to the virus rather than the clear cause of death. Now, thanks to a lawsuit in Colorado, the state was forced to revise its death count down by 23 % over the weekend — from 1,150 to 878. The state is now publishing numbers of deaths “with” COVID-19 separate from deaths “from” COVID-19. As I reported on Thursday, county officials started accusing the state’s department of health of reclassifying deaths of those who tested positive for the virus but died of things like alcohol poisoning as COVID-19 deaths just to insidiously inflate the numbers. This revision in Colorado is a bombshell story that, of course, will remain unknown to most Americans. Every state needs to do this, and if they did, we would find an across-the-board drop in numbers by at least 25%, the same %age by which Dr. Birx reportedly believes the count is being inflated, according to the Washington Post. For example, in Minnesota, state officials are now admitting that every single person who dies in a nursing home after testing positive is now deemed to have died from the virus, never mind the fact that 25% of all natural deaths in a given week occur in nursing homes and that most cases of COVID-19 are asymptomatic, which means more often than not, they died exclusively of other causes.
TO WIT… Dennis Prager’s guest is Dr. Joel Hay, who is a professor in the department of Pharmaceutical Economics and Policy at the University of Southern California. Both give examples of cancer deaths being coded Covid:
And my third evidence to support my contention a nurse is filmed commenting on the percentages of deaths at NYC hospital. In my posts point #2 (the video still up amazingly) notes that every death cert in NYC-hospital is coded as Rona. In fact, 99% of deaths from that hospital were coded Rona during a period — AN IMPOSSIBLE statistic (https://tinyurl.com/y9awsuor — my site)
….In New York City, around 12,000 people have supposedly died from COVID-19 at the time of this writing. That’s 22% of all alleged U.S. deaths.
Around 7,000 of the NYC deaths attributed to COVID-19 have been thoroughly investigated to determine if there was another serious life-threatening illness present
Take a deep breath if doing so hasn’t been outlawed where you live.
99.2% of those 7,000 New Yorkers who supposedly died from the virus had another antecedent life-threatening illness. For all intents and purposes, that’s all of them.
How is it even remotely possible that 7,000 NYC deaths attributed to COVID-19 were investigated and virtually every single one of them found to have involved at least one other life-threatening illness if the virus is in and of itself deadly?
Most strains of coronavirus that affect humans are common cold viruses.
In light of the apparent almost universal prevalence of at least one other deadly disease among the alleged NYC deceased…
And in light of all the factors massively inflating the bogus death tally we’re being fed every day…
What reason do we have to believe COVID-19 is actually killing anyone?
No one knows how many Americans have really died of COVID-19….
However, we are starting to find out that “pure” deaths caused by Covid-19 exclusivelt is low (DAILY WIRE):
On Tuesday, San Diego county Supervisor Jim Desmond said after digging into the data that he believes only six of the county’s 194 coronavirus-identified deaths are “pure” coronavirus deaths, meaning they died from the virus, not merely with the virus.
Desmond was seemingly ruling out deaths from individuals with preexisting conditions.
“We’ve unfortunately had six pure, solely coronavirus deaths — six out of 3.3 million people,” Desmond said on a podcast, Armstrong & Getty Extra Large Interviews, according to San Diego Tribune. “I mean, what number are we trying to get to with those odds. I mean, it’s incredible. We want to be safe, and we can do it, but unfortunately, it’s more about control than getting the economy going again and keeping people safe.”
Public Health Officer Dr. Wilma Wooten suggested Wednesday during a press briefing that Desmond was being callous, noting that their liberal identification of COVID-19 deaths is uniform with coding nationwide.
“Their life is no less valuable than someone’s life who does not have underlying medical conditions,” Wooten said. “This is not just San Diego. This is how this is done throughout the entire nation in terms of identifying who has died of COVID-19.”…
Also note that all the anti-body tests are showing a larger infected population than previously considered. REASON.COM previously noted the Stanford study that between “48,000 and 81,000 residents of Santa Clara County, California are likely to have already been infected by the coronavirus that causes COVID-19.” Stanford University has revised the numbers to better fit the assumption (via MERCURY NEWS):
…In a revised analysis of a startling study published last month, they now estimate that 2.8% of Santa Clara residents were previously infected by the virus but didn’t know it.
That implies that the county had up to 54,000 infections — many more than the 1,000 confirmed cases in the county at the time.
“This suggests that the large majority of the population does not have antibodies and may be susceptible to the virus,” concludes the research paper, published in the online report medRxiv….
MY COMMENTS FROM MY FACEBOOK ABOUT THE ABOVE
So, Stanford settled on a number in early April… when there were 1,000 CONFIRMED cases were known in Santa Clara, there were 54,000 infected. To REALLY understand the percentages you would have to follow those 1,000 KNOWN cases from that time and compare the 55,000 cases to those deaths. (BTW, Stanford took the lower path on stats; so there could be a larger number.) Here is part of the article… but know that with the flu shot, there are more deaths by the flu than The Rona, without a “Rona shot.”
UPDATE (trying to figure out deaths per infections): Okay, let us apply the 98% survive who are known to have it and are hospitalized stat I have heard for some time. So 2% of the 1,000 is 20. 20 deaths from that early April figure of 55,000. Right? Gives you… 0.036%
UPDATES!
A friend on FACEBOOK has been a light in the war-torn field of The Rona (Wu Flu) battle of infection rates. Here are two posts of his [combined with a response to a friendly comment from one of his peeps] followed by some recent articles (links to papers will be in graphics):
Here’s a new meta-study from Stanford of all of the antibody testing that’s happened.
This puts the Wu Flu anywhere between 7x LESS deadly than the flu and 2.8x MORE deadly than the flu (making it a little worse than a bad flu season like 2018). And that’s assuming that this doesn’t follow SARS 1 and just disappear.
The data behind this is really solid, and the author is well-respected. Unlike those stupid models we were using, this is really real data.
We don’t do contact tracing, social distancing, mask-wearing, or lockdowns for the seasonal flu, and this looks like a watered down seasonal flu that got 100000000x more media attention and governors sending sick people to nursing homes to boost up the death rate.
The original post (OP) on this second strain was a graphic. I will link to the Kent County (Michigan site through it. Here is my FB description of the following: “A person named B.M. wrote on a friends Facebook wall the following regarding “contact tracing.” (The original post had to do with hiring government employees to trace citizens with Covid.)”
[A reader of JP’snoted] Actually, contact tracing sounds like a legitimate work of government. Rather than quarantining the healthy, quarantine the sick and monitor those exposed to the disease.
JP responded:
Sorry in advance for the novel! Heh, I started thinking of other interesting things to add and just decided to run with it.
Contact tracing might work for illnesses that don’t spread very easily (it probably would have exterminated HIV, according to what I’ve read; I’m no expert but it seems reasonable), but for upper respiratory stuff like colds and flus (and the Wu Flu), it’s pretty much doomed, especially with up to 10% of the whole country already having the it.
The original point of the lockdowns (which don’t seem to have worked; lockdown and non-lockdown countries and states have almost identical statistics) was to slow the spread to prevent hospitals from being overwhelmed. It wasn’t to stop spread, since even the CDC admits that after about 1% of people are infected with a contagious disease, you can’t really close the door on it anymore. Contact tracing is a relatively invasive way of closing the door on a virus, so I don’t think it will work here**.
The data points to a much less lethal bug, though. Stanford’s meta analysis of all of the large-scale antibody testing shows an IFR (Infection Fatality Rate) between 7 times less than the seasonal flu and 2.8 times more. It’s probably in the middle, making it slightly less lethal than regular seasonal flus. And since we know it has been in the US at least since January (probably since December or earlier), the R? (Basic Reproduction Number or Rate) is also much lower than people originally thought. So it spreads like the flu and is as deadly as the flu.
The main difference seems to be the 24/7 media terrorizing of citizens, the complete ignorance most of us (that’s me, too) had in the real pneumonia/influenza deaths each year, and the downright evil policy of many Democrat governors of sending the sick to recover (while contagious) at nursing homes, boosting the deaths by up to 50%.
Sorry for the novel!! Reading every little bit about this thing has become an unfortunate hobby of mine. I’m of the mind now that the best strategy is to fight the fear instead of the virus and to get back to normal in virtually every way. If this is anything like it’s older brother SARS, it will die out in the next couple of months. But if not, keeping everyone from immunity just means extending the risk.
**I think contact tracing may -appear- to work because I think we are naturally bottoming out cases. Same, in my mind, for other measures.
One final bit: I’ve followed lots of different predictions to see who might get things most accurately to see what they did differently. This guy’s been right on (it’s been almost scary) using SARS as a comparison instead of the Spanish Flu (since this bug is SARS 2). This is a really good visual of the whole thing:
(Click to enlarge)
ALSO, a short bit from Bruce Carrol:
“If you are waiting for a “cure” for COVID-19, you’ll never leave your home again.
Even the flu vaccine (not vaccine, flu shot. There is a vaccine for the Polio, not HIV or SARS) results in 60-80,000 deaths every season.
We have to stop the fearmongering and start learning to live with a new virus in a string of new viruses that have emerged for tens of thousands of years.
Boomers and Millennials aren’t that special of a species.”
— Bruce Carroll (Co-founder of the gay Republican group GOProu, and founder of GAYPATRIOT)
One of the great unknowns of the COVID-19 crisis is just how deadly the disease is. Much of the panic dates from the moment, in early March, when the World Health Organization (WHO) published a mortality rate of 3.2 percent — which turned out to be a crude ‘case fatality rate’ dividing the number of deaths by the number of recorded cases, ignoring the large number of cases which are asymptomatic or otherwise go unrecorded.
The Imperial College modeling, which has been so influential on the UK government, assumed an infection fatality rate (IFR) of 0.9 percent. This was used to compute the infamous prediction that 250,000 Britons would die unless the government abandoned its mitigation strategy and adopted instead a policy of suppressing the virus through lockdown. Imperial later revised its estimate of the IFR down to 0.66 percent — although the March 16 paper which predicted 250,000 deaths was not updated.
In the past few weeks, a slew of serological studies estimating the prevalence of infection in the general population has become available. This has allowed Prof John Ioannidis of Stanford University to work out the IFR in 12 different locations.
They range between 0.02 percent and 0.5 percent — although Ioannidis has corrected those raw figures to take account of demographic balance and come up with estimates between 0.02 percent and 0.4 percent. The lowest estimates came from Kobe, Japan, found to have an IFR of 0.02 percent and Oise in northern France, with an IFR of 0.04 percent. The highest were in Geneva (a raw figure of 0.5 percent) and Gangelt in Germany (0.28 percent).
The usual caveats apply: most studies to detect the prevalence of the SARS-CoV-2 virus in the general population remain unpublished, and have not yet been peer-reviewed. Some are likely to be unrepresentative of the general population. The Oise study, in particular, was based on students, teachers and parents in a single high school which was known to be a hotspot on COVID-19 infection. At the other end of the table, Geneva has a relatively high age profile, which is likely to skew its death rate upwards.
But it is noticeable how all these estimates for IFR are markedly lower than the figures thrown about a couple of months ago, when it was widely asserted that COVID-19 was a whole magnitude worse than flu. Seasonal influenza is often quoted as having an IFR of 0.1 to 0.2 percent. The Stanford study suggests that COVID-19 might not, after all, be more deadly than flu — although, as Ioannidis notes, the profile is very different: seasonal flu has a higher IFR in developing countries, where vaccination is rare, while COVID-19 has a higher death rate in the developed world, thanks in part of more elderly populations.
The Stanford study, however, does not include the largest antibody study to date: that involving a randomized sample of 70,000 Spanish residents, whose preliminary results were published by the Carlos III Institute of Health two weeks ago. That suggested that five percent of the Spanish population had been infected with the virus. With 27,000 deaths in the country, that would convert to an IFR of 1.1 percent.
This backs up of course some excellent article by Daniel Horowitz:
A CLEARER PICTURE has a great post about this as well, I suggest if you like what you see you check out that blog weekly.
…For one thing, Dr. Fauci and Dr. Birx have both explicitly stated that anyone dying WITH the virus is counted as dying FROM it. Since 4/5 of COVID-19 infections are mild and 1/2 appear to show no symptoms at all, the official U.S. death tally is bound to include many in which it played little or no role.
The CDC has made matters much worse by insisting that doctors list COVID-19 on death certificates without a positive test confirming its presence and even absent any medical justification at all. A willingness to “assume” it was a factor is all that’s officially required. And hospitals now reap enormous financial rewards for making the assumption.
(Click To Enlarge)
Those in charge couldn’t have possibly shown less interest in determining the real number of Americans who would still be alive if not for having contracted COVID-19. It’s unlikely that ours is the only country in which the data has been turned into garbage by a perfect storm of inflating factors. As hard as it may be to accept, the odds are pretty much nil that we’ll ever know how deadly the virus we were made to spend months obsessively fearing really was.
Even on the inflated numbers we’re getting, however, it isn’t anywhere near 10 times deadlier than the flu; as Dr. Fauci claimed on March 11, while ginning up support for his novel public health strategy of extinguishing our rights and wrecking the economy. But, of course, a few weeks later, we learned that even Fauci didn’t believe a word of the lie he so effectively used to terrorize a nation of over 300 million people into suicidal obedience.
Though perhaps you haven’t heard. You see, on March 26, Dr. Fauci shared his true opinion with his peers in the pages of the prestigious New England Journal of Medicine:
The overall clinical consequences of Covid-19 may ultimately be more akin to those of a severe seasonal influenza (which has a case fatality rate of approximately 0.1%).
Dr. Anthony Fauci, March 26, 2020 New England Journal of Medicine
In case you’re wondering, the parenthetical remark is his, not mine. Moreover, when Sharyl Attkisson contacted the journal about the strange discrepancy between what Fauci was scaring the public with and the substantially less alarming take his learned colleagues heard, she discovered his article had been submitted “many weeks ago.”….
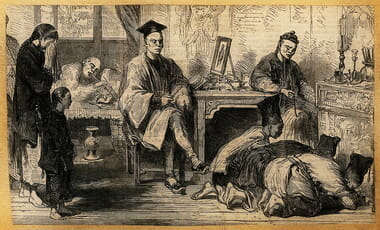
DEFINITION: To kneel and touch the forehead to the ground in expression of deep respect, worship, or submission, as formerly done in China…. To show servile deference. synonym: fawn.
Vietnamese mandarins kowtowing before the Governor-General of Tonkin
AMERICAN THINKERhas an intro to the below Tucker Carlson video I wish to excerpt from before you watch the video:
…Back in the 1960s, authority figures also collapsed before the black mob. Shelby Steele, in WHITE GUILT, describes how his college president, the quintessential white liberal who gave to all the Civil Rights causes, backed down like a deflated balloon:
Dr. McCabe simply came to a place where his own knowledge of American racism—knowledge his personal integrity prevented him from denying—opened a vacuum of moral authority within him. He was not suddenly stricken with pangs of guilt over American racism. He simply found himself without the moral authority to reprimand us for our disruptive behavior. He knew that we had a point, that our behavior was in some way connected to centuries of indisputable injustice. So he was trumped by his knowledge of this, not by his remorse over it, though he may have felt such remorse. Our outrage at racism simply had far greater moral authority than his outrage over our breach of decorum. And had he actually risen to challenge us, I was prepared to say that we would worry about our behavior when he and the college started worrying about the racism we encountered everywhere, including on his campus.
And this is when I first really saw white guilt in action. Now I know it to be something very specific: the vacuum of moral authority that comes from simply knowing that one’s race is associated with racism. Whites (and American institutions) must acknowledge historical racism to show themselves redeemed of it, but once they acknowledge it, they lose moral authority over everything having to do with race, equality, social justice, poverty, and so on. They step into a void of vulnerability. The authority they lose transfers to the “victims” of historical racism and becomes their great power in society. This is why white guilt is quite literally the same thing as black power.
Steele, Shelby, White Guilt [Kindle Locations 370-374]. HarperCollins; emphasis mine.
In the 1960s, thanks to Jim Crow and endemic racism in the Northeast, whites had good reason to feel guilty.
But what about whites in 2020? Well, that’s where the Big Lie comes in….
Why Are Americans Surrendering To Violent Mobs? Because They’ve Been Told They Have To
Here is an excellent CITY-JOURNAL article that Heather Mac Donald draws sensible reactions to these outliers:
…Many protest supporters have expressed frustration with the attention being given to a relative handful of agitators driving the violence and looting—behavior, they say, that distorts the image of what is largely a peaceful movement. Their frustration is understandable but also ironic: the narrative that has driven thousands into the streets is itself a distortion. Just as the violence that has alarmed the American public does not represent the peaceful protesters exercising their right to air their grievances, the police violence depicted in viral videos does not characterize the institution of law enforcement.
This is not to say that police are perfect, or that officers never abuse their power; they are not perfect, and some do succumb to what can be an intoxicating sense of authority. This is a truth I’ve personallyexperienced. Nor is it to say that there is no room to improve policing and to make police-citizen encounters both safer and less fraught. But if there is to be any hope for peacefully bridging the gap so strikingly represented by the glass-covered asphalt separating rioters and police, destructive hyperbole needs to be recognized for what it is.
[….]
This is in line with other data I highlighted in these pages two years ago—namely, a 2018 study published in the Journal of Trauma and Acute Care Surgery, which analyzed more than 114,000 criminal arrests made across three midsize police departments, finding that more than 99 percent of arrests were carried out without the use of physical force. In 98 percent of the cases in which those officers did use physical force, suspects “sustained no or mild injury.”
Historical context is important, too. In 1971, New York City Police discharged their firearms 810 times, wounding 221 people and killing 93. By 1990, those numbers were down to 307, 72, and 39, respectively. In 2016, police discharged their weapons just 72 times, wounding 23, killing 9. This is real progress; but it would come as news to anyone observing the mobs that have spent the last few days hurling insults, rocks, and Molotov cocktails at exhausted and demoralized members of the NYPD.
As troubling as cases like that of George Floyd are, we must remember that they are outliers. That knowledge won’t bring comfort or justice to those harmed or killed by police who use unjustifiable force, or their families; but it can help lower the temperature in an environment that is about as inhospitable to reasonable discussion as can be imagined. …
THE DAILY CALLER weighs in:
…However, this destructive delusion has been completely demolished by a recent study that demonstrates there is no epidemic of racially biased police shootings of black people, that black citizens are not more likely to be shot by white officers, and that the shooting of unarmed people of any race is extraordinarily rare. In fact, an individual American citizen is substantially more likely to be struck by lightning than he is to be shot by the police while unarmed.
In the article, published in the Proceedings of the National Academy of Sciences, Joseph Cesario of Michigan State University and David Johnson of the University of Maryland assess hundreds of fatal police shootings since 2015. Their groundbreaking study exposes what is, at least for the anti-police mythmakers, an inconvenient truth indeed — that police shootings of citizens are not motivated by race or racism.
Here are the facts: 55% of all people fatally shot in America by the police are white — more than double the number of black (27%) or Hispanic (19%) individuals. Those police critics who accept at least this fact are generally quick to point out that black citizens are 27% of the people shot and killed by the police despite making up only 14% of the U.S. population. They say this disparity provides statistical proof of “systemic racism and bias,” but this superficial explanation doesn’t stand up. There are racial disparities in police shootings, but the disparities are not caused by racism.
According to Cesario and Johnson, who analyzed crime data from more than 200 U.S. counties, the strongest predictor of being shot by the police isn’t a person’s race, but whether the person is engaging in violent criminal behavior. Disparities across the major races in rates of police shooting are almost entirely consistent with the rates at which members of these different races are accused by victims of committing violent crimes. In other words, the greater the number of crimes committed by white individuals in a county, the more likely a white person will be shot by the police. And poor white Americans in Appalachia, for example, often are involved in police shootings. But, the greater number of crimes committed by black individuals in a county, the more likely it is that a black person will be shot by the police. The same is true for Hispanic individuals.
It’s not “systemic racism” that makes it more likely that a person will be shot by the police; it is how mathematically likely that person is to be committing crime. An individual’s behavior, not his race, is the determining factor.
The claim that racial bias on the part of individual officers is the cause of racial disparities in police shootings was also specifically found to be untrue. The researchers determined that: “The race of the officer doesn’t matter when it comes to predicting whether a black or white citizen will be shot.” White officers are no more likely to shoot a black person than are black or Hispanic officers. Not only is racial bias on the part of individual officers not a significant predictor of police shootings of black people, but also, remarkably, police officers off all races are statistically less likely to shoot a black than a white person under the same circumstances….
Hold officers accountable who use excessive force. But there’s no evidence of widespread racial bias.
By Heather Mac Donald June 2, 2020
George Floyd’s death in Minneapolis has revived the Obama-era narrative that law enforcement is endemically racist. On Friday, Barack Obama tweeted that for millions of black Americans, being treated differently by the criminal justice system on account of race is “tragically, painfully, maddeningly ‘normal.’ ” Mr. Obama called on the police and the public to create a “new normal,” in which bigotry no longer “infects our institutions and our hearts.”
Joe Biden released a video the same day in which he asserted that all African-Americans fear for their safety from “bad police” and black children must be instructed to tolerate police abuse just so they can “make it home.” That echoed a claim Mr. Obama made after the ambush murder of five Dallas officers in July 2016. During their memorial service, the president said African-American parents were right to fear that their children may be killed by police officers whenever they go outside.
Minnesota Gov. Tim Walz denounced the “stain . . . of fundamental, institutional racism” on law enforcement during a Friday press conference. He claimed blacks were right to dismiss promises of police reform as empty verbiage.
This charge of systemic police bias was wrong during the Obama years and remains so today. However sickening the video of Floyd’s arrest, it isn’t representative of the 375 million annual contacts that police officers have with civilians. A solid body of evidence finds no structural bias in the criminal-justice system with regard to arrests, prosecution or sentencing. Crime and suspect behavior, not race, determine most police actions.
In 2019 police officers fatally shot 1,004 people, most of whom were armed or otherwise dangerous. African-Americans were about a quarter of those killed by cops last year (235), a ratio that has remained stable since 2015. That share of black victims is less than what the black crime rate would predict, since police shootings are a function of how often officers encounter armed and violent suspects. In 2018, the latest year for which such data have been published, African-Americans made up 53% of known homicide offenders in the U.S. and commit about 60% of robberies, though they are 13% of the population.
The police fatally shot nine unarmed blacks and 19 unarmed whites in 2019, according to a Washington Post database, down from 38 and 32, respectively, in 2015. The Post defines “unarmed” broadly to include such cases as a suspect in Newark, N.J., who had a loaded handgun in his car during a police chase. In 2018 there were 7,407 black homicide victims. Assuming a comparable number of victims last year, those nine unarmed black victims of police shootings represent 0.1% of all African-Americans killed in 2019. By contrast, a police officer is 18½ times more likely to be killed by a black male than an unarmed black male is to be killed by a police officer.
On Memorial Day weekend in Chicago alone, 10 African-Americans were killed in drive-by shootings. Such routine violence has continued—a 72-year-old Chicago man shot in the face on May 29 by a gunman who fired about a dozen shots into a residence; two 19-year-old women on the South Side shot to death as they sat in a parked car a few hours earlier; a 16-year-old boy fatally stabbed with his own knife that same day. This past weekend, 80 Chicagoans were shot in drive-by shootings, 21 fatally, the victims overwhelmingly black. Police shootings are not the reason that blacks die of homicide at eight times the rate of whites and Hispanics combined; criminal violence is.
The latest in a series of studies undercutting the claim of systemic police bias was PUBLISHEDin August 2019 in the Proceedings of the National Academy of Sciences. The researchers found that the more frequently officers encounter violent suspects from any given racial group, the greater the chance that a member of that group will be fatally shot by a police officer. There is “no significant evidence of antiblack disparity in the likelihood of being fatally shot by police,” they concluded.
A 2015 Justice Department analysis of the Philadelphia Police Department found that white police officers were less likely than black or Hispanic officers to shoot unarmed black suspects. Research by Harvard economist Roland G. Fryer Jr. also found no evidence of racial discrimination in shootings. Any evidence to the contrary fails to take into account crime rates and civilian behavior before and during interactions with police.
The false narrative of systemic police bias resulted in targeted killings of officers during the Obama presidency. The pattern may be repeating itself. Officers are being assaulted and shot at while they try to arrest gun suspects or respond to the growing riots. Police precincts and courthouses have been destroyed with impunity, which will encourage more civilization-destroying violence. If the Ferguson effect of officers backing off law enforcement in minority neighborhoods is reborn as the Minneapolis effect, the thousands of law-abiding African-Americans who depend on the police for basic safety will once again be the victims.
The Minneapolis officers who arrested George Floyd must be held accountable for their excessive use of force and callous indifference to his distress. Police training needs to double down on de-escalation tactics. But Floyd’s death should not undermine the legitimacy of American law enforcement, without which we will continue on a path toward chaos.
Sean Hannity had Larry Elder (lawyer/radio talk show host, author) and Leo Terrell (a well-known civil rights attorney and radio talk show host) on his radio program to discuss the event in Minnesota. Apparently, Larry has been chomping at the bit to lay into Leo? I know why… the lie that the Left, the Media, and lawyers like Leo spread about racist cops and racial divides in America are what have contributed in great part (as well as other areas where the Left hurts the minority community — welfare, affirmative action, fatherless homes, etc.) to what we see happening in parts of our nation as I type. And Leo is a figure head in protecting this horribly negative ethos in the black community. Larry takes it personally.
ROUND ONE
PART ONE is the opening salvo… Leo Terrell had no idea “The Sage from South Central” came to scrap… and Leo never recovered. You will notice at times Hannity trying to be referee, because Leo is in the ring with someone above his weight class.
ROUND TWO
PART TWO Larry discusses police shooting stats by ethnicity, the absence of fathers, Hannity defends Leo because Leo is in the ring with someone above his weight class and Sean feels bad.
ROUND THREE
PART THREE Hannity discusses Trump responding quickly, as well as bringing up the Minneapolis prosecutor saying he has evidence that does not meet the charges. Leo because Leo is in the ring with someone above his weight class and Sean feels bad.
“I will say this. That video is graphic, horrific and terrible and no person should do that. But my job in the end is to prove that he violated a criminal statute. And there is other evidence that does not support a criminal charge. We need to wade through all of that evidence to come to a meaningful determination and we are doing that to the best of our ability.” – Michael Freeman (RIGHT SCOOP)
ROUND FOUR
PART FOUR Hannity brings up Obama’s quote about the issue of these recent riots (see RED STATE for more). Leo Terrell slams Obama, then Larry brings up Obama’s abysmal record on racial issues during his Presidency.
ROUND FIVE
PART FIVE Hannity notes there are a high majority of great police officers, Leo basically agree… sorta. Larry Elder gets his parting shots in and he expands on “institutional racism” canard.
This first part of a multi-part post is merely to discuss what the Flattening the curve was for ~ AND THAT WAS ~ not over-burden our healthcare system.
…The goal is no longer to prevent the virus from spreading freely from person to person, as it was in the outbreak’s early days. Instead, the objective is to spread out the inevitable infections so that the healthcare system isn’t overwhelmed with patients.
Public health officials have a name for this: Flattening the curve.
The curve they’re talking about plots the number of infections over time. In the beginning of an outbreak, there are just a few. As the virus spreads, the number of cases can spike. At some point, when there aren’t as many people left for the pathogen to attack, the number of new cases will fall. Eventually, it will dwindle to zero.
If you picture the curve, it looks like a tall mountain peak. But with containment measures, it can be squashed into a wide hill.
The outbreak will take longer to run its course. But if the strategy works, the number of people who are sick at any given time will be greatly reduced. Ideally, it will fall below the threshold that would swamp hospitals, urgent care clinics and medical offices, said Dr. Gabor Kelen, chair of the emergency medicine department at Johns Hopkins University…
LOS ANGELES TIMES: Why We Should Still Try To Contain The Coronavirus
The coronavirus outbreak that has sickened at least 125,000 people on six continents and caused nearly 4,600 deaths is now an official global pandemic. But that doesn’t mean we should give up on trying to contain it, health experts say. The goal is no longer to prevent the virus from spreading freely from person to person, as it was in the outbreak’s early days. Instead, the objective is to spread out the inevitable infections so that the healthcare system isn’t overwhelmed with patients. Public health officials have a name for this: Flattening the curve. (Healy and Khan, 3/11)
ABC NEWS: Why Flattening The Curve For Coronavirus Matters (March 11, 2020)
NBC NEWS: What Is ‘Flatten The Curve‘? The Chart That Shows How Critical It Is For Everyone To Fight Coronavirus Spread. (March 11, 2020)
Confirming the above, you will see that the trend line was to spread out the disease, not to defeat it. And this endeavor would take two weeks at the least, six at the most:
Anywhere from 20 percent to 60 percent of the adults around the world may be infected with the new coronavirus SARS-CoV-2, the virus that causes the disease COVID-19. That’s the estimate from leading epidemiological experts on communicable disease dynamics.
[….]
So yes, even if every person on Earth eventually comes down with COVID-19, there are real benefits to making sure it doesn’t all happen in the NEXT FEW WEEKS.
Dena Grayson, MD, PhD, a Florida-based expert in Ebola and other pandemic threats, told Medscape Medical News that EvergreenHealth in Kirkland, Washington, is a good example of what it means when a virus overwhelms healthcare operations.
[….]
Grayson points out that the COVID-19 cases come on top of a severe flu season and the usual cases hospitals see, so the bar on the graphic is even lower than it usually would be.
“We have a relatively limited capacity with ICU beds to begin with,” she said.
So far, closures, postponements, and cancellations are woefully inadequate, Grayson said.
“We can’t stop this virus. We can hope to contain it and slow down the rate of infection,” she said.
“We need to right now shut down all the schools, preschools, and universities,” Grayson said. “We need to look at shutting down public transportation. We need people to stay home — AND NOT FOR A DAY BUT FOR A COUPLE OF WEEKS.”
The graphic was developed by visual-data journalist Rosamund Pearce, based on a graphic that had appeared in a Centers for Disease Control and Prevention (CDC) article titled “Community Mitigation Guidelines to Prevent Pandemic Influenza,” the Times reports.
To slow down the spread of the pandemic virus in areas that are beginning to experience local outbreaks and thereby allow time for the local health care system to prepare additional resources for responding to increased demand for health care services (CLOSURES UP TO 6 WEEKS)
On the other hand, if that same large number of patients arrived at the hospital at a slower rate, for example, OVER THE COURSE OF SEVERAL WEEKS, the line of the graph would look like a longer, flatter curve.
And, here is a conversation via my Facebook that elucidates how people have this idea of saving lives mixed up with not pressuring or overwhelming our healthcare system
EXCERPT FROM FACEBOOK CONVO
(ME)
Steve W — you do know Steve that the same amount of death from and infection due to Covid-19 exists under the trend line of doing nothing and the most strict quarentine rules…. right? In other words, we are not saving lives. And, in fact, we have made it worse for our economy next fall/winter because it is coming back as it makes its rounds around the world.
(STEVE W)
Sean Giordano I have heard that said but not seen it from a credible source. So I think that is false.
(ME)
Steve W what is false?
(STEVE W)
Sean Giordano “the same amount of death from and infection due to Covid-19 exists under the trend line of doing nothing”
(ME)
Steve Wallace now you are saying don’t listen to Dr. Fauci?
Many bemoan Trump for not listening to him (even though he has), and some I meet do not support Fauci in the idea that this was to elongate the process as to not put any undue stress on our health care system. Even though he clearly announced multiple times this was the reason to do so
WORLD ECONOMIC FORUMmentions the following, and all the graphs of the United States shown by Doctors Fauci and Birx have all used this idea as well (graph below from CDC and WEF)
CHRIS WALLACE: All right. You talk about slowing the virus down. You talk a lot, and I’ve very used to this now, you can either have a bump like this of cases or you could make it maybe the same total cases, but it’s a much more gradual and slower and longer curve. I want to put up some numbers. We have in this country about 950,000 hospital beds, and about 45,000 beds in Intensive Care Unit. How worried are you that this virus is going to overwhelm hospitals, not just beds, but ventilators? We only have 160,000 ventilators. And could we be in a situation where you have to ration who gets the bed, who gets the ventilator?
DR. FAUCI: OK. So let me put it in a way that it doesn’t get taken out of context. When people talk about modeling where outbreaks are going, the modeling is only as good as the assumptions you put into the model. And what they do, they have a worst-case scenario, a best-case scenario, and likely where it’s going to be. If we have a worst-case scenario, we’ve got to admit it, we could be overwhelmed. Are we going to have a worst-case scenario? I don’t think so. I hope not.
What are we doing to not have that worst-case scenario? That’s when you get into the things that we’re doing. We’re preventing infections from going in with some rather stringent travel restrictions. And we’re doing containment and mitigation from within. So, at a worst-case scenario, anywhere in the world, no matter what country you are, you won’t be prepared. So our job is to not let that worst-case scenario happen.
(…. STILL ME….)
STEVE W for you not to understand the goal of all this, and then get on here sharing insights is itself insightful. I am not blaming you STEVE… I just see this fundamental misunderstanding of the underlying factors and goals of this whole endeavor of bending the curve as applicable to MANY A PERSON in these discussions here and elsewhere on social media. I am giving you, in fact, the most respectful benefit of a doubt, but am merely in conversation with you at this moment. This conversation is just multiplied (others are having) across social media many fold. Blessings to you and yours friend. Yet, this foundational view is not known well by others… that is, the reason behind flattening the curve as well as the data underneath the trend line.
(CLICK TO ENLARGE)
Here I wish to switch gears a bit and start to discuss another “info graphic” post from MY SITES FACEBOOK I shared with my readers. And since the entire idea behind “flattening the curve” was to keep the health and hospital system working well by not getting inundated all at once, this should have lasted two or three weeks. Not as long as it has — our economy is important too! Damnit!
CAPACITY OF THE HEALTHCARE SYSTEM
The following was compiled after a conversation I had on Facebook. It touches on some of the issues above. Enjoy
I note the bell curve because many are under the false impression we are doing this to “save lives.” This was never the case.
The quarantine was to lessen the apex of the bell curve as to not put pressure on the hospital/health system. The same amount of people in the elongated “quarantine bell curve” (the trend-line) would die and get sick. In other words, the same statistics exist below the line (POWERLINE). Here is a site cataloging the hospitalizations for the rona that POWERLINE used – US CORONAVIRUS HOSPITALIZATIONS …they used both the CDC site and this one, but the CDC site has lower hospitalizations, so they opted for the most updated numbers. WHICH AS OF APRIL 21ST STAND AT 84,292 HOSPITALIZATIONS FROM JANUARY TILL NOW. This is important, because, the flu season of 2017-2018 we saw 810,000 hospitalization, and our health system didn’t collapse. Nor did the Swine Flu of 2009-to-2010, which saw 60-million American infected and 300,000 hospitalizations.
This then may explain why all the field hospital’s the ARMY CORE OF ENGINEERS built are being dismantled without a single bed being used.
The panic and fear among the people who cannot be bothered to read the actual statistics about this pandemic is what should concern most preppers. In fact, this virus has been so overhyped that the Army’s field hospital in Seattle, an “epicenter” of the pandemic has closed after three days without seeing one single COVID-19 patient. According to a report by Military.com, the hastily built field hospital set up by the Army in Seattle’s pro football stadium is shutting down without ever seeing a patient. [….] The decision to close the Seattle field hospital comes amid early signs that the number of new cases could be hitting a plateau in New York, the epicenter of the coronavirus epidemic in the U.S., and other states. At a news conference Friday, New York Governor Andrew Cuomo said, “Overall, New York is flattening the curve.” — ZERO HEDGE (see: MILITARY TIMES | DAILY CALLER)
Unlike the Mercy, the Comfort is treating COVID-19 patients on board as well as patients who do not have the virus. The ship has treated more than 120 people since it arrived March 30, and about 50 of those have been discharged, said Lt. Mary Catherine Walsh. The ship removed half of its 1,000 beds so it could isolate and treat coronavirus patients. [The Mercy has seen 48 patients, all non-Covid related] (THE STAR)
And literally handfulls of patients on the Comfort (New York City) and the Comfort (Los Angeles) — *see comment below. There was never a shortage of respirators (NATIONAL REVIEW), and we may surpass the 2018-to-2019 flu death rate, but come nowhere close to the 2017-to-2018 flu death rate:
(CLICK TO ENLARGE)
And it seems that we are reaching a plateau with The Rona, so there is good news in this regard (POWERLINE).
* Here is a comment from the Military Times article from a few days ago:
So, why did we spend all that Taxpayer’s money to move the Comfort to NYC and all the added Military medical personnel to staff the Javitt’s Center? Because Cuomo was crying WOLF.
“So far, the thousands of beds provided by a converted convention center and a hospital ship have not been needed, but the extra personnel are coming in handy for the city’s civilian hospitals.
About 200 doctors, nurses, respiratory therapists and others are working in New York’s medical centers, where bed space has not been overwhelmed, but where hospital-acquired coronavirus cases have sidelined civilian staff.”
…TO WIT…
HOSPITALS GOING BANKRUPT
VOX actually has a decent story on this:
Medical University of South Carolina in Charleston is laying off 900 people from its 17,000-person staff and asking full-time salaried employees to take a 15 percent pay cut, according to the Post & Courier; the hospital says it’s not laying off front-line workers at this time.
Essentia Health, a major medical system of clinics and hospitals in Duluth, Minnesota, is laying off 500 workers, per KBJR.
The Cookeville Regional Medical Center in Tennessee will be furloughing 400 of its 2,400-person staff, and a few hundred others will see a cut in their hours, Fox 17 Nashville reports.
Boston Medical Center is furloughing 10 percent of its staff, about 700 people, according to the Boston Globe.
Trinity Health Mid-Atlantic, which runs five hospitals in the Philadelphia area and employs 125,000 people there, will furlough an unspecific percentage of its staff, per the Philadelphia Inquirer.
Two hospital systems in West Virginia are furloughing upward of 1,000 employees combined, Metro News reports.
The largest hospital system in eastern Kentucky is laying off 500 workers, according to the Lexington Herald-Leader.
I’m sure there are many more stories like these. But you get the idea.
Hospitals have typically said in these announcements that they are starting with nonmedical staff for furloughs and reduced hours, which is no solace to those workers but softens the impact on our medical capacity.
But it’s not clear how long medical systems can avoid cutting doctors and nurses as well, and some of them clearly cannot. I heard from a nurse in Texas, who asked that neither she nor her hospital be named for fear of professional repercussions, who has been furloughed because of the ongoing economic crisis.
She said how constrained she felt by the news. If she wanted to help with the coronavirus response by taking a job with a travel nursing service offering temporary postings in Covid-19 hot spots, for example, she would lose her old job and her health insurance.
”It really is frustrating to hear that you’re a hero but also we don’t value you enough to prepare or pay you,” she said. “I would be happy to temporarily relocate, work in a hot spot, and make the same wages as I normally would. I can’t afford to work for free, exactly, but it’s frustrating if I can’t work at all.”
Hospitals have taken huge revenue losses as they postpone elective surgeries and other routine care so they can make more staff and space available for the Covid-19 response. Some hospitals expect to lose half their income, and the top industry trade groups have warned that hundreds of hospitals could close after this crisis.
Congress pumped $100 billion into US hospitals as part of its first stimulus package, and Democratic leaders are already calling for another $100 billion in the next stimulus bill they hope Congress will pass.
But that may still not be enough, in the end. When one in four rural hospitals were already vulnerable to closure before the coronavirus struck, the current pandemic is almost certainly going to leave some hospitals with no choice but to close, no matter how much money the federal government provides….
And to compliment the Left leaning VOX article is the “Right” leaning FEDERALIST article:
….During a press conference Wednesday, Florida Gov. Ron DeSantis noted that health experts initially projected 465,000 Floridians would be hospitalized because of coronavirus by April 24. But as of April 22, the number is slightly more than 2,000.
Even in New York, where Gov. Andrew Cuomo said last month he would need 30,000 ventilators, hospitals never came close to needing that many. The projected peak need was about 5,000, and actual usage may have been even lower.
Other overflow measures have also proven unnecessary. On Tuesday, President Trump said the USNS Comfort, the Navy hospital ship that had been deployed to New York to provide emergency care for coronavirus patients, will be leaving the city. The ship had been prepared to treat 500 patients. As of Friday, only 71 beds were occupied. An Army field hospital set up in Seattle’s pro football stadium shut down earlier this month without ever having seen a single patient.
It’s the same story in much of the country. In Texas, where this week Gov. Greg Abbott began gradually loosening lockdown measures, including a prohibition on most medical procedures, hospitals aren’t overwhelmed. In Dallas and Houston, where coronavirus cases are concentrated in the state, makeshift overflow centers that had been under construction might not be used at all.
In Illinois, where hospitals across the state scrambled to stock up on ventilators last month, fewer than half of them have been put to use—and as of Sunday, only 757 of 1,345 ventilators were being used by COVID-19 patients. In Virginia, only about 22 percent of the ventilator supply is being used.
Meanwhile, hospitals and health care systems nationwide have had to furlough or lay off thousands of employees. Why? Because the vast majority of most hospitals’ revenue comes from elective or “non-essential” procedures. We’re not talking about LASIK eye surgery but things like coronary angioplasty and stents, procedures that are necessary but maybe not emergencies—yet. If hospitals can’t perform these procedures because governors have banned them, then they can’t pay their bills, or their employees.
To take just one example, a friend who works in a cardiac intensive care unit (ICU) in rural Virginia called recently and told me about how they had reorganized their entire system around caring for coronavirus patients. They had cancelled most “non-essential” procedures, imposed furloughs and pay cuts, and created a special ICU ward for patients with COVID-19. So far, they have had only one patient. One. The nurses assigned to the COVID-19 ward have very little to do. In the entire area covered by this hospital system, only about 30 people have tested positive for COVID-19.
If Hospitals Can Handle The Load, End The Lockdowns
I’m sure the governors and health officials who ordered these lockdowns meant well. They based their decisions on deeply flawed and woefully inaccurate models, and they should have been less panicky and more skeptical, but they were facing a completely new disease about which, thanks to China, they had almost no reliable information.
However, in hindsight it seems clear that treating the entire country as if it were New York City was a huge mistake that has cost millions of American jobs and destroyed untold amounts of wealth. Now that we know our hospitals aren’t going to be overrun by COVID-19 cases, governors and mayors should immediately reverse course and begin opening their states and communities for business…..
More than half of U.S. deaths are from nursing homes — THE GUARDIAN:
Yale professor describes as ‘staggering’ research that reveals more than half of all deaths in 14 US states from elderly care facilities
The average age group who dies from “The Rona” is found here in the latest from WORLD O’METER:
Not only that, but the co-morbidities (just as in flu deaths) are high and in multiples. Some examples:
Of the 22,332 people who died in hospital in England between 31 March and 12 May, 5,873 (26%) suffered from either type 1 or type 2 diabetes, NHS England figures reveal. That was the most common illness found in an analysis of what existing conditions patients had. The other commonest comorbidities were dementia (18%), serious breathing problems (15%) and chronic kidney disease (14%). One in ten (10%) suffered from ischaemic heart disease. (GUARDIAN)
A new study published April 22 in the Journal of the American Medical Association characterizes the symptoms, comorbidities, and clinical outcomes of 5,700 patients hospitalized because of COVID-19 in the New York area. The authors found that 94 percent of the patients had a chronic health problem, and 88 percent had two or more. The three most prevalent conditions were hypertension (56.6 percent), obesity (41.7 percent), and diabetes (33.8 percent). (THE SCIENTIST)
Now, many of these deaths were preventable, but for some reason many of the hardest hit states had a tragic policy of sending elderly patients back to nursing homes to recover. Many of the blue states, where most of the deaths have occurred:
If you live in New Jersey, you are 13 times more likely to die from COVID-19 than if you live in Florida. The Garden State’s death rate per million is 895.2, according to the RealClearPolitics coronavirus tracker, compared to only 65.1 deaths per million for Florida. This disparity can’t be written off to demography or testing. Florida has a huge elderly population, and it has conducted twice as many tests as New Jersey. (AMERICAN SPECTATOR)
I have a slew of articles regarding this deadly choice by Andrew Cuomo on my site (FULLY reproduced here):
MAY I ALSO NOTE that I believe the deaths from The Rona are a bit overstated, while Dr. Birx noted that the CDC may be inflating the death toll by 25%, I provide a couple other examples to support my claim. First up, Dr. Birx setting the stage for this with how deaths are coded:
Another example comes from Dr. Ngozi, Director of public health Illinois. She explains how ALL deaths are counted as Covid-19 even if the patient was diagnosed to have die from another disease:
1) The shocking inflation of COVID-19 death numbers: From day one, we were warned that states are ascribing every single death of anyone who happens to test positive for the coronavirus — even if they are asymptomatic — to the virus rather than the clear cause of death. Now, thanks to a lawsuit in Colorado, the state was forced to revise its death count down by 23 % over the weekend — from 1,150 to 878. The state is now publishing numbers of deaths “with” COVID-19 separate from deaths “from” COVID-19. As I reported on Thursday, county officials started accusing the state’s department of health of reclassifying deaths of those who tested positive for the virus but died of things like alcohol poisoning as COVID-19 deaths just to insidiously inflate the numbers. This revision in Colorado is a bombshell story that, of course, will remain unknown to most Americans. Every state needs to do this, and if they did, we would find an across-the-board drop in numbers by at least 25%, the same %age by which Dr. Birx reportedly believes the count is being inflated, according to the Washington Post. For example, in Minnesota, state officials are now admitting that every single person who dies in a nursing home after testing positive is now deemed to have died from the virus, never mind the fact that 25% of all natural deaths in a given week occur in nursing homes and that most cases of COVID-19 are asymptomatic, which means more often than not, they died exclusively of other causes.
TO WIT… Dennis Prager’s guest is Dr. Joel Hay, who is a professor in the department of Pharmaceutical Economics and Policy at the University of Southern California. Both give examples of cancer deaths being coded Covid:
And my third evidence to support my contention a nurse is filmed commenting on the percentages of deaths at NYC hospital. In my posts point #2 (the video still up amazingly) notes that every death cert in NYC-hospital is coded as Rona. In fact, 99% of deaths from that hospital were coded Rona during a period — AN IMPOSSIBLE statistic (https://tinyurl.com/y9awsuor — my site)
….In New York City, around 12,000 people have supposedly died from COVID-19 at the time of this writing. That’s 22% of all alleged U.S. deaths.
Around 7,000 of the NYC deaths attributed to COVID-19 have been thoroughly investigated to determine if there was another serious life-threatening illness present
Take a deep breath if doing so hasn’t been outlawed where you live.
99.2% of those 7,000 New Yorkers who supposedly died from the virus had another antecedent life-threatening illness. For all intents and purposes, that’s all of them.
How is it even remotely possible that 7,000 NYC deaths attributed to COVID-19 were investigated and virtually every single one of them found to have involved at least one other life-threatening illness if the virus is in and of itself deadly?
Most strains of coronavirus that affect humans are common cold viruses.
In light of the apparent almost universal prevalence of at least one other deadly disease among the alleged NYC deceased…
And in light of all the factors massively inflating the bogus death tally we’re being fed every day…
What reason do we have to believe COVID-19 is actually killing anyone?
No one knows how many Americans have really died of COVID-19….
However, we are starting to find out that “pure” deaths caused by Covid-19 exclusivelt is low (DAILY WIRE):
On Tuesday, San Diego county Supervisor Jim Desmond said after digging into the data that he believes only six of the county’s 194 coronavirus-identified deaths are “pure” coronavirus deaths, meaning they died from the virus, not merely with the virus.
Desmond was seemingly ruling out deaths from individuals with preexisting conditions.
“We’ve unfortunately had six pure, solely coronavirus deaths — six out of 3.3 million people,” Desmond said on a podcast, Armstrong & Getty Extra Large Interviews, according to San Diego Tribune. “I mean, what number are we trying to get to with those odds. I mean, it’s incredible. We want to be safe, and we can do it, but unfortunately, it’s more about control than getting the economy going again and keeping people safe.”
Public Health Officer Dr. Wilma Wooten suggested Wednesday during a press briefing that Desmond was being callous, noting that their liberal identification of COVID-19 deaths is uniform with coding nationwide.
“Their life is no less valuable than someone’s life who does not have underlying medical conditions,” Wooten said. “This is not just San Diego. This is how this is done throughout the entire nation in terms of identifying who has died of COVID-19.”…
Also note that all the anti-body tests are showing a larger infected population than previously considered. REASON.COM previously noted the Stanford study that between “48,000 and 81,000 residents of Santa Clara County, California are likely to have already been infected by the coronavirus that causes COVID-19.” Stanford University has revised the numbers to better fit the assumption (via MERCURY NEWS):
…In a revised analysis of a startling study published last month, they now estimate that 2.8% of Santa Clara residents were previously infected by the virus but didn’t know it.
That implies that the county had up to 54,000 infections — many more than the 1,000 confirmed cases in the county at the time.
“This suggests that the large majority of the population does not have antibodies and may be susceptible to the virus,” concludes the research paper, published in the online report medRxiv….
MY COMMENTS FROM MY FACEBOOK ABOUT THE ABOVE
So, Stanford settled on a number in early April… when there were 1,000 CONFIRMED cases were known in Santa Clara, there were 54,000 infected. To REALLY understand the percentages you would have to follow those 1,000 KNOWN cases from that time and compare the 55,000 cases to those deaths. (BTW, Stanford took the lower path on stats; so there could be a larger number.) Here is part of the article… but know that with the flu shot, there are more deaths by the flu than The Rona, without a “Rona shot.”
UPDATE (trying to figure out deaths per infections): Okay, let us apply the 98% survive who are known to have it and are hospitalized stat I have heard for some time. So 2% of the 1,000 is 20. 20 deaths from that early April figure of 55,000. Right? Gives you… 0.036%
UPDATES!
A friend on FACEBOOK has been a light in the war-torn field of The Rona (Wu Flu) battle of infection rates. Here are two posts of his [combined with a response to a friendly comment from one of his peeps] followed by some recent articles (links to papers will be in graphics):
Here’s a new meta-study from Stanford of all of the antibody testing that’s happened.
This puts the Wu Flu anywhere between 7x LESS deadly than the flu and 2.8x MORE deadly than the flu (making it a little worse than a bad flu season like 2018). And that’s assuming that this doesn’t follow SARS 1 and just disappear.
The data behind this is really solid, and the author is well-respected. Unlike those stupid models we were using, this is really real data.
We don’t do contact tracing, social distancing, mask-wearing, or lockdowns for the seasonal flu, and this looks like a watered down seasonal flu that got 100000000x more media attention and governors sending sick people to nursing homes to boost up the death rate.
The original post (OP) on this second strain was a graphic. I will link to the Kent County (Michigan site through it. Here is my FB description of the following: “A person named B.M. wrote on a friends Facebook wall the following regarding “contact tracing.” (The original post had to do with hiring government employees to trace citizens with Covid.)”
[A reader of JP’snoted] Actually, contact tracing sounds like a legitimate work of government. Rather than quarantining the healthy, quarantine the sick and monitor those exposed to the disease.
JP responded:
Sorry in advance for the novel! Heh, I started thinking of other interesting things to add and just decided to run with it.
Contact tracing might work for illnesses that don’t spread very easily (it probably would have exterminated HIV, according to what I’ve read; I’m no expert but it seems reasonable), but for upper respiratory stuff like colds and flus (and the Wu Flu), it’s pretty much doomed, especially with up to 10% of the whole country already having the it.
The original point of the lockdowns (which don’t seem to have worked; lockdown and non-lockdown countries and states have almost identical statistics) was to slow the spread to prevent hospitals from being overwhelmed. It wasn’t to stop spread, since even the CDC admits that after about 1% of people are infected with a contagious disease, you can’t really close the door on it anymore. Contact tracing is a relatively invasive way of closing the door on a virus, so I don’t think it will work here**.
The data points to a much less lethal bug, though. Stanford’s meta analysis of all of the large-scale antibody testing shows an IFR (Infection Fatality Rate) between 7 times less than the seasonal flu and 2.8 times more. It’s probably in the middle, making it slightly less lethal than regular seasonal flus. And since we know it has been in the US at least since January (probably since December or earlier), the R? (Basic Reproduction Number or Rate) is also much lower than people originally thought. So it spreads like the flu and is as deadly as the flu.
The main difference seems to be the 24/7 media terrorizing of citizens, the complete ignorance most of us (that’s me, too) had in the real pneumonia/influenza deaths each year, and the downright evil policy of many Democrat governors of sending the sick to recover (while contagious) at nursing homes, boosting the deaths by up to 50%.
Sorry for the novel!! Reading every little bit about this thing has become an unfortunate hobby of mine. I’m of the mind now that the best strategy is to fight the fear instead of the virus and to get back to normal in virtually every way. If this is anything like it’s older brother SARS, it will die out in the next couple of months. But if not, keeping everyone from immunity just means extending the risk.
**I think contact tracing may -appear- to work because I think we are naturally bottoming out cases. Same, in my mind, for other measures.
One final bit: I’ve followed lots of different predictions to see who might get things most accurately to see what they did differently. This guy’s been right on (it’s been almost scary) using SARS as a comparison instead of the Spanish Flu (since this bug is SARS 2). This is a really good visual of the whole thing:
(Click to enlarge)
ALSO, a short bit from Bruce Carrol:
“If you are waiting for a “cure” for COVID-19, you’ll never leave your home again.
Even the flu vaccine (not vaccine, flu shot. There is a vaccine for the Polio, not HIV or SARS) results in 60-80,000 deaths every season.
We have to stop the fearmongering and start learning to live with a new virus in a string of new viruses that have emerged for tens of thousands of years.
Boomers and Millennials aren’t that special of a species.”
— Bruce Carroll (Co-founder of the gay Republican group GOProu, and founder of GAYPATRIOT)
One of the great unknowns of the COVID-19 crisis is just how deadly the disease is. Much of the panic dates from the moment, in early March, when the World Health Organization (WHO) published a mortality rate of 3.2 percent — which turned out to be a crude ‘case fatality rate’ dividing the number of deaths by the number of recorded cases, ignoring the large number of cases which are asymptomatic or otherwise go unrecorded.
The Imperial College modeling, which has been so influential on the UK government, assumed an infection fatality rate (IFR) of 0.9 percent. This was used to compute the infamous prediction that 250,000 Britons would die unless the government abandoned its mitigation strategy and adopted instead a policy of suppressing the virus through lockdown. Imperial later revised its estimate of the IFR down to 0.66 percent — although the March 16 paper which predicted 250,000 deaths was not updated.
In the past few weeks, a slew of serological studies estimating the prevalence of infection in the general population has become available. This has allowed Prof John Ioannidis of Stanford University to work out the IFR in 12 different locations.
They range between 0.02 percent and 0.5 percent — although Ioannidis has corrected those raw figures to take account of demographic balance and come up with estimates between 0.02 percent and 0.4 percent. The lowest estimates came from Kobe, Japan, found to have an IFR of 0.02 percent and Oise in northern France, with an IFR of 0.04 percent. The highest were in Geneva (a raw figure of 0.5 percent) and Gangelt in Germany (0.28 percent).
The usual caveats apply: most studies to detect the prevalence of the SARS-CoV-2 virus in the general population remain unpublished, and have not yet been peer-reviewed. Some are likely to be unrepresentative of the general population. The Oise study, in particular, was based on students, teachers and parents in a single high school which was known to be a hotspot on COVID-19 infection. At the other end of the table, Geneva has a relatively high age profile, which is likely to skew its death rate upwards.
But it is noticeable how all these estimates for IFR are markedly lower than the figures thrown about a couple of months ago, when it was widely asserted that COVID-19 was a whole magnitude worse than flu. Seasonal influenza is often quoted as having an IFR of 0.1 to 0.2 percent. The Stanford study suggests that COVID-19 might not, after all, be more deadly than flu — although, as Ioannidis notes, the profile is very different: seasonal flu has a higher IFR in developing countries, where vaccination is rare, while COVID-19 has a higher death rate in the developed world, thanks in part of more elderly populations.
The Stanford study, however, does not include the largest antibody study to date: that involving a randomized sample of 70,000 Spanish residents, whose preliminary results were published by the Carlos III Institute of Health two weeks ago. That suggested that five percent of the Spanish population had been infected with the virus. With 27,000 deaths in the country, that would convert to an IFR of 1.1 percent.
This backs up of course some excellent article by Daniel Horowitz:
A CLEARER PICTURE has a great post about this as well, I suggest if you like what you see you check out that blog weekly.
…For one thing, Dr. Fauci and Dr. Birx have both explicitly stated that anyone dying WITH the virus is counted as dying FROM it. Since 4/5 of COVID-19 infections are mild and 1/2 appear to show no symptoms at all, the official U.S. death tally is bound to include many in which it played little or no role.
The CDC has made matters much worse by insisting that doctors list COVID-19 on death certificates without a positive test confirming its presence and even absent any medical justification at all. A willingness to “assume” it was a factor is all that’s officially required. And hospitals now reap enormous financial rewards for making the assumption.
(Click To Enlarge)
Those in charge couldn’t have possibly shown less interest in determining the real number of Americans who would still be alive if not for having contracted COVID-19. It’s unlikely that ours is the only country in which the data has been turned into garbage by a perfect storm of inflating factors. As hard as it may be to accept, the odds are pretty much nil that we’ll ever know how deadly the virus we were made to spend months obsessively fearing really was.
Even on the inflated numbers we’re getting, however, it isn’t anywhere near 10 times deadlier than the flu; as Dr. Fauci claimed on March 11, while ginning up support for his novel public health strategy of extinguishing our rights and wrecking the economy. But, of course, a few weeks later, we learned that even Fauci didn’t believe a word of the lie he so effectively used to terrorize a nation of over 300 million people into suicidal obedience.
Though perhaps you haven’t heard. You see, on March 26, Dr. Fauci shared his true opinion with his peers in the pages of the prestigious New England Journal of Medicine:
The overall clinical consequences of Covid-19 may ultimately be more akin to those of a severe seasonal influenza (which has a case fatality rate of approximately 0.1%).
Dr. Anthony Fauci, March 26, 2020 New England Journal of Medicine
In case you’re wondering, the parenthetical remark is his, not mine. Moreover, when Sharyl Attkisson contacted the journal about the strange discrepancy between what Fauci was scaring the public with and the substantially less alarming take his learned colleagues heard, she discovered his article had been submitted “many weeks ago.”….
In addition to record unemployment numbers, experts now predict that a “wave” of small business bankruptcies is on the horizon — and it could leave the United States with 40% fewer small businesses.
The New York Times reports that the United States Chamber of Commerce estimates “more than 40 percent of the nation’s 30 million small businesses could close permanently in the next six months” — a statistic entirely attributable to the coronavirus pandemic and ensuing lockdowns.
The economic consequences of such a mass business failure could last for “generations,” the NYT reports.
“Commercial bankruptcies in the first quarter of 2020 ticked up 4 percent from a year earlier, according to data from the American Bankruptcy Institute,” according to the NYT. “But many of those filings were made before the pandemic, when the economy was healthy. Right now, some owners are waiting to find out if they will receive federal stimulus aid before deciding whether to file for bankruptcy protection.”
Restaurants and retail services are, of course, the most vulnerable, but family-owned enterprises, like heating and cooling operations and plumbing companies, and even health-care services, particularly small dental and pediatric practices, are in severe danger. The Small Business Restructuring Act, which took effect in February, could help some small businesses stay above water, but many are struggling to keep people on the payroll, to compete with unemployment insurance, and to handle mounting debt.
Of course, large companies — and, in particular, large retail outlets — are not immune to the economic effects of coronavirus. Brands like Neiman Marcus, J. Crew, JC Penney, Macy’s, Gap, GNC, and David’s Bridal are all staring down the possibility that their stores may not reopen once coronavirus lockdowns are lifted, according to USA Today. CNBC says that at least 150 companies, from airline conglomerates to healthcare providers, have warned investors to expect major earnings hits.
The bad economic news keeps piling. In addition to closures, a jobs report, due out from the Department of Labor on Thursday, “will almost certainly show that the coronavirus pandemic inflicted the largest one-month blow to the U.S. labor market on record,” per the Wall Street Journal……
Do fast shutdowns work to combat the unfold of Covid-19? Joe Malchow, Yinon Weiss and I needed to search out out. We got down to quantify what number of deaths have been brought on by delayed shutdown orders on a state-by-state foundation.
To normalize for an unambiguous comparability of deaths between states on the midpoint of an epidemic, we counted deaths per million inhabitants for a set 21-day interval, measured from when the dying charge first hit 1 per million—e.g.,‒three deaths in Iowa or 19 in New York state. A state’s “days to shutdown” was the time after a state crossed the 1 per million threshold till it ordered companies shut down.
We ran a easy one-variable correlation of deaths per million and days to shutdown, which ranged from minus-10 days (some states shut down earlier than any signal of Covid-19) to 35 days for South Dakota, one in every of seven states with restricted or no shutdown. The correlation coefficient was 5.5%—so low that the engineers I used to make use of would have summarized it as “no correlation” and moved on to search out the true reason behind the issue. (The trendline sloped downward—states that delayed extra tended to have decrease dying charges—however that’s additionally a meaningless consequence because of the low correlation coefficient.)
No conclusions could be drawn concerning the states that sheltered rapidly, as a result of their dying charges ran the total gamut, from 20 per million in Oregon to 360 in New York. This vast variation implies that different variables—like inhabitants density or subway use—have been extra necessary. Our correlation coefficient for per-capita dying charges vs. the inhabitants density was 44%. That implies New York Metropolis may need benefited from its shutdown—however blindly copying New York’s insurance policies in locations with low Covid-19 dying charges, akin to my native Wisconsin, doesn’t make sense.
(CLICK TO ENLARGE)
Sweden is preventing coronavirus with common sense tips which can be a lot much less economically damaging than the lockdowns in most U.S. states. Since individuals over 65 account for about 80% of Covid-19 deaths, Sweden requested solely seniors to shelter in place slightly than shutting down the remainder of the nation; and since Sweden had no pediatric deaths, it didn’t shut down elementary and center colleges. Sweden’s containment measures are much less onerous than America’s, so it will possibly preserve them in place longer to forestall Covid-19 from recurring. Sweden didn’t shut down shops, eating places and most companies, however did shut down the Volvo automotive plant, which has since reopened, whereas the Tesla plant in Fremont, Calif., was shuttered by police and stays closed.
How did the Swedes do? They suffered 80 deaths per million 21 days after crossing the 1 per million threshold stage. With 10 million individuals, Sweden’s dying charge‒and not using a shutdown and big unemployment‒is decrease than that of the seven hardest-hit U.S. states—Massachusetts, Rhode Island, Louisiana, Connecticut, Michigan, New Jersey and New York—all of which, besides Louisiana, shut down in three days or much less. Regardless of tales about excessive dying charges, Sweden’s is in the midst of the pack in Europe, akin to France; higher than Italy, Spain and the U.Okay.; and worse than Finland, Denmark and Norway. Older individuals in care properties accounted for half of Sweden’s deaths.
We must always cheer for Sweden to succeed, not ghoulishly bash them. They could show that many features of the U.S. shutdown have been errors—ineffective however economically devastating—and level the way in which to correcting them.
Mr. Rodgers was founding CEO of Cypress Semiconductor Corp.
Predicting the future. And how they always get it wrong. The simple truth is that the doomsayers always get it wrong. Way wrong. Check out Jason’s take.
I noticed some of the viral videos by Drs. Daniel Erickson and Artin Massihi are being removed from YouTube. As it turns out, YouTube apparently are using the World Health Organizations proclamations as their guiding light to censor people free speech/thought. Here Laura Ingraham notes the issue:
Basically the Doctors in their original video (can be seen HERE, HERE, Channel 23 Bakersfield has it HERE, see also HERE) were basically saying it is time to open up California. The video has been removed from YouTube — hard to find. 23ABC BAKERSFIELD has the FULL video on their Facebook still:
Similarly, another doctor in the heart of the battle in New York says it is time to open back up, via the NEW YORK POST:
I’m an emergency physician at St. Barnabas Hospital in The Bronx. I have been in the ER every day these last few weeks, either supervising or providing direct care. I contracted a COVID-19 infection very early in the outbreak, as did two of my daughters, one of whom is a nurse. We are all well, thank God.
COVID-19 has been the worst health care disaster of my 30-year career, because of its intensity, duration and potential for lasting impact. The lasting impact is what worries me the most. And it’s why I now believe we should end the lockdown and rapidly get back to work.
[….]
It is precisely what I have witnessed that now tells me that it’s time to ease the lockdown. Here’s why.
First, the wave has crested. At 1 p.m. April 7, the COVID-19 arrivals slowed down. It was a discrete, noticeable event. Stretchers became available by 5 p.m., and the number of arriving COVID-19 patients dropped below the number discharged, transferred or deceased.
This was striking, because the community I serve is poor. Some are homeless. Most work in “essential,” low-paying jobs, where distancing isn’t easy. Nevertheless, the wave passed over us, peaked and subsided. The way this transpired tells me the ebb and flow had more to do with the natural course of the outbreak than it did with the lockdown.
Second, I worry about non-coronavirus care. While the inpatient units remain busy with sick COVID-19 patients, our ER has been quiet for more than a week. We usually average 240 patients a day. For the last week, we averaged fewer than 100. That means our patients in this diverse, low-income community are afraid to come to the ER for non-COVID care.
Gotham-wide, the number of 911 ambulance runs declined to 3,320 on April 18, down from a peak of 6,527 on March 30, according to New York Fire Department data. The current nadir is significantly below the average.
A large share of those staying home surely have emergency medical and surgical conditions not related to the novel coronavirus. The growing numbers dying at home during this crisis must include fatal myocardial infarctions, asthma exacerbations, bacterial infections and strokes.
Meanwhile, our pediatric volume in the ER has practically disappeared. Visits to primary-care pediatricians are also down, with vaccine schedules falling behind. Everyone seems to be avoiding the health system — an important and unfortunate consequence of the stay-at-home strategy.
Third, inordinate fear misguides the public response. While COVID-19 is serious, fear of it is being over-amplified. The public needs to understand that the vast majority of infected people do quite well.
Finally, COVID-19 is more prevalent than we think. Many New Yorkers already have the COVID-19 infection, whether they are aware of it or not. As of today, over 43 percent of those tested are positive in The Bronx. We are developing a significant degree of natural herd immunity. Distancing works, but I am skeptical that it is playing as predominant a role as many think.
More testing will better establish the numbers among those with mild illnesses and no symptoms. My professional experience tells me the number of infected people will be high. Testing is important work, but it should happen in parallel to the immediate resuscitation of the economy and getting people back to work.
At present, the testing is imperfect. We can’t wait months. We must protect the vulnerable and mitigate without destroying the economy…..
All of these doctors are in agreement that Covid-19 is serious. But they are also in agreement on two things, that is:
California is not New York;
The economy is an important monetary and healthy factor.
To Wit…
Armstrong & Getty discuss Brett Stephens New York Times article where it seems the rest of America is being asked to respond to The Rona just like New York City is. In an excellent article Brett notes:
As of Friday, there have been more Covid-19 fatalities on Long Island’s Nassau County (population 1.4 million) than in all of California (population 40 million). There have been more fatalities in Westchester County (989) than in Texas (611). The number of Covid deaths per 100,000 residents in New York City (132) is more than 16 times what is in America’s next largest city, Los Angeles (8). If New York City proper were a state, it would have suffered more fatalities than 41 other states combined… (NEW YORK TIMES)
THE FEDERALIST likewise uses Brett’s article as a launch pad, noting:
The claim that New York is not responsible for the severe lockdowns we see across the country is the kind of revisionist history that we will all be drowned in over the coming weeks. Through late March and early April, Drs. Deborah Birx and Anthony Fauci made clear time and again that their recommendations were based mostly on data from New York, where the most cases and testing existed.
Now there is a debunking of sorts making the rounds…
FACEBOOK CONVOS
…the first I was made aware of it was by a friend in the health industry. He sent me a link to this statement by the The American College of Emergency Physicians (ACEP) and the American Academy of Emergency Medicine (AAEM):
The American College of Emergency Physicians (ACEP) and the American Academy of Emergency Medicine (AAEM) jointly and emphatically condemn the recent opinions released by Dr. Daniel Erickson and Dr. Artin Massihi. These reckless and untested musings do not speak for medical societies and are inconsistent with current science and epidemiology regarding COVID-19. As owners of local urgent care clinics, it appears these two individuals are releasing biased, non-peer reviewed data to advance their personal financial interests without regard for the public’s health.
COVID-19 misinformation is widespread and dangerous. Members of ACEP and AAEM are first-hand witnesses to the human toll that COVID-19 is taking on our communities. ACEP and AAEM strongly advise against using any statements of Drs. Erickson and Massihi as a basis for policy and decision making.
Then a couple other friends who disagree with a video by Drs. Daniel Erickson and Artin Massihi or just Dr. Erickson, noted both the above, and one was kind enough to post an article that specifically noted where the doctors “got it wrong.” And please do not get me wrong, I love friends that disagree with me. Why? Because it hones my knowledge of a topic. For instance, a friend posted this article from CALMATTERS “debunking” Dr. Erickson’s first video. But he wasn’t aware of another video that already responds to the charges he makes! I will post my shorter version of IT following the dialogue:
JIM G. In a rare statement late today, the American College of Emergency Physicians and the American Academy of Emergency Medicine declared they “emphatically condemn the recent opinions released by Dr. Daniel Erickson and Dr. Artin Messihi. These reckless and untested musings do not speak for medical societies and are inconsistent with current science and epidemiology regarding COVID-19. As owners of local urgent care clinics, it appears these two individuals are releasing biased, non-peer reviewed data to advance their personal financial interests without regard for the public’s health.” [then he linked the CALMATTERS article]
After I noted my post on my site… JIM G. said:
the article points out the very basic methodological flaw. It’s flaw in their study is so elementary, it’s ridiculous.
Since I like to get people to commit to a premise they want to defend, I simply asked: “what flaw Jim”
JIM G. simple lack of random sampling and suggesting that their findings can be extrapolated to a larger population.
//… But public health experts were quick to debunk the doctors’ findings as misguided and riddled with statistical errors — and an example of the kind of misleading information they are forced to waste precious time disputing.
The doctors should never have assumed that the patients they tested — who came for walk-in COVID-19 tests or who sought urgent care for symptoms they experienced in the middle of a pandemic — are representative of the general population, said Dr. Carl Bergstrom, a University of Washington biologist who specializes in infectious disease modeling. He likened their extrapolations to “estimating the average height of Americans from the players on an NBA court.” And most credible studies of COVID-19 death rates in reality are far higher than the ones the doctors presented.//
ME JIM G. in this video he said it cannot be extrapolated to another population? (YOUTUBE), and they started to test everyone who asked?
This has to be the worst example of flaws since the Dr. refuted them even before he was rebuked? The only flaws I see have been the gargantuan numbers thrown around by the modelers themselves. California is no where near the deaths near the flu.
VIDEO ISOLATED
Likewise, another friend focused on the same issue. What was different however is that he posted under the previous video my other friend was not aware of. And may I say, I doubt this friend, JEREMY J, watched the video he commented under — just assuming it was the original video. Likewise though, the above video is great for his response as well:
JEREMY J. I recently posted this elsewhere.
For those of you who have watched the video of Bakersfield California doctors Dan Erickson and Artin Massihi, owners of Accelerated Urgent Care with multiple office locations including Kern County, you should know that their core message “Millions of cases, small amount of death” is based on very bad data analytics.
For most of the presentation, Dr. Erickson does most of the talking. When I use “they” or “their” please understand that I am usually referring to Dr. Erickson.
They took the number of tests they had done in their own clinics (5213) and the number of positive results they had from those tests (340, or 6.5%), and “extrapolated” (their words) that data to the entire state. That is how they arrived at 4.4 million Californians already infected.
But in order to extrapolate, you must be comparing similar groups. The group of people who have been tested is unlikely to have the same rate of infection as the general population, and there is no evidence offered that they do. The doctors simply assume that Californians as a whole would have positive tests at the same rate as symptomatic people who come in for testing. This is a basic failing on their part and by itself makes the claim “Millions of cases, small amount of death” invalid.
They then cite the California statewide numbers (280,900 tests, 33,865, or 12%). Based on these numbers, Dr. Erickson then says “so the more you test, the more positives you get, the prevalence number goes up, and the death rate stays the same, so it gets smaller and smaller and smaller.”
This is such confused thinking that it’s hard to know where to start, especially for an audience unversed in statistical and epidemiological terminology. OF COURSE you will get more positive results if you test more people, but that isn’t what he is trying to say. Dr. Erickson appears to be saying that if more tests are done, the *percent* of positive results goes up. That is magical thinking. It certainly isn’t science. More likely, the difference between their local numbers and the statewide numbers is a manifestation of either different testing criteria, or Kern County simply has fewer cases than California as a whole (infection rates would not be expected to be uniform across the state).
Far from being based on facts, data, and science, their core message that there are “Millions of cases, small amount of death” is based on assumption, conjecture, speculation, and magical thinking.
I’ve watched the entire hour long news conference. It is obvious to me that they do not understand some basic things about microbiology and immunology. They use “incidence” and “prevalence” interchangeably, even though they are very different concepts. They misunderstand the concept of “herd immunity”. And they tout their real world, on the ground experience as more valid than that of an academician, even though they haven’t worked in a hospital setting for several years and haven’t cared for seriously ill COVID-19 patients. Wise physicians understand that both perspectives are valid.
To be sure, they make some good points, and I think they are generally well intentioned. But their overall message is fundamentally weakened by some seriously sloppy data analysis as well as sloppy use of terms.
Note he makes it clear their intentions are good. That is nice, but these are my responses:
ME No, he says in the video you cannot extrapolate his work to the state. He says that specifically. But then notes another California study. And as they test this way (random testing), other states are finding the same issue.
Just as one example, at a homeless shelter in Boston, out of the nearly 400 guests tested, 146 tested positive for Covid-19… all were asymptomatic.
…the other study mentioned by Dr. Erickson was this one mentioned in theREASON.COMarticle. These studies are all proving my early work (mid to late March), which I speak about here:RPT
In a humorous short discussion via email with A CLEARER PICTURE, a neat play on the word Fascism was noted by him that I wish to highlight here. It is a simple joining of two words:
Dr. Fauci + fascism = Faucism
Here is his short prose using the term:
[That] Statement you sent me from College of Physicians is unbelievable. This is getting serious. Fauscism is as contemptuous of our rights to share information and make up our own minds as they are of our rights to earn a living and freely assemble.”
On my Facebook, a friend said this: “I posted this as well. These [doctors] absolutely nail it. I’m tellin’ y’all, I’m feelin’ the ‘1984’ thing right now!” What this will do and is doing is the false modeling and the covering up of tracks by saying on the death certificate’s of people told they have a month to live because of cancer… and then this breakout appears on the scene, and while they are in the hospital dying, they catch The Rona. Their death cert doesn’t say “died of cancer, it says “died of Covid-19.”
After reading A CLEARER PICTURE’S latest post about the censorship, I remembered it was Tuesday, and boogied on over toTOWNHALL.COMto see Prager’s latest column. Here is a large excerpt from it:
…“Police state” does not mean totalitarian state. America is not a totalitarian state; we still have many freedoms. In a totalitarian state, this article could not be legally published, and if it were illegally published, I would be imprisoned and/or executed. But we are presently living with all four of the key hallmarks of a police state:
No. 1: Draconian laws depriving citizens of elementary civil rights.
The federal, state, county and city governments are now restricting almost every freedom except those of travel and speech. Americans have been banned from going to work (and thereby earning a living), meeting in groups (both indoors and outdoors), meeting in their cars in church parking lots to pray and entering state-owned properties such as beaches and parks — among many other prohibitions.
No. 2: A mass media supportive of the state’s messaging and deprivation of rights.
The New York Times, CNN and every other mainstream mass medium — except Fox News, The Wall Street Journal (editorial and opinion pages only) and talk radio — have served the cause of state control over individual Americans’ lives just as Pravda served the Soviet government. In fact, there is almost no more dissent in The New York Times than there was in Pravda. And the Big Tech platforms are removing posts about the virus and potential treatments they deem “misinformation.”
No. 3: Use of police.
Police departments throughout America have agreed to enforce these laws and edicts with what can only be described as frightening alacrity. After hearing me describe police giving summonses to, or even arresting, people for playing baseball with their children on a beach, jogging alone without a mask, or worshipping on Easter while sitting isolated in their cars in a church parking lot, a police officer called my show. He explained that the police have no choice. They must respond to every dispatch they receive.
“And why are they dispatched to a person jogging on a beach or sitting alone in a park?” I asked.
Because the department was informed about these lawbreakers.
“And who told the police about these lawbreakers?” I asked.
His answer brings us to the fourth characteristic of a police state:
No. 4: Snitches.
How do the police dispatchers learn of lawbreakers such as families playing softball in a public park, lone joggers without face masks, etc.? From their fellow citizens snitching on them. The mayor of New York City, Bill de Blasio, set up a “snitch line,” whereby New Yorkers were told to send authorities photos of fellow New Yorkers violating any of the quarantine laws. Los Angeles Mayor Eric Garcetti similarly encouraged snitching, unabashedly using the term.
It is said that about 1 in every 100 East German citizens were informers for the Stasi, the East German secret police, as superbly portrayed in the film “The Lives of Others.” It would be interesting, and, I think, important, to know what percentage of New Yorkers informed on their fellow citizens. Now, again, you may think such a comparison is not morally valid, that de Blasio’s call to New Yorkers to serve a Stasi-like role was morally justified given the coronavirus pandemic. But you cannot deny it is Stasi-like or that, other than identifying spies during World War II, this is unprecedented in American history at anywhere near this level…..
This coincides with my post on a friends Facebook last night, where I said after mentioning the removal of Drs. Daniel Erickson and Artin Massihi video:
Certain books and videos removed from Amazon for not being politically-correct. Posts removed from Facebook for not marching in step. YouTube removing or “doxing” videos that they say do not meet their guidelines (just think of Prager U’s fight). Twitter, etc.
You know, many years ago I wrote the Koch Brothers and tried to get a letter to them (being big libertarians) about starting a server for people to compete with YouTube and other blog hosting sites. Because I know at some point hosting sites will limit my speech to fit the prevailing PC winds.
The owner of the blog “A Clearer Picture” mentioned to me the following after seeing the above statement: “[That] Statement you sent me from College of Physicians is unbelievable. This is getting serious. Fauscism is as contemptuous of our rights to share information and make up our own minds as they are of our rights to earn a living and freely assemble.”
“Fauscism” what a great “medical” play on words. (Based on Dr. Fauci)
And yes, giving up our rights to modelers and to the World Health Organization (scientism) is a form of FAUCISM. Speaking to one of the models that led to what should have been a two or three week shut down was this one noted at TOWNHALL.COM (on April 5th):
While the reporting data from some states are lagging, others have provided information that calls into question the validity of the whole model, and with it, all the actions taken by government.
On April 4th, for example, the IHME model predicted there would be between 120,963 and 203,436 Americans requiring hospitalization, with the average of that range being 164,745. In reality, there were 18,998…..
Sick, and because of the hatred for Trump from the Left and #NeverTrumpers… this is only the beginning of the emboldening of what they think they can do to us. As CNN and other’s say this is a trial run for:
The World Is Coming Together To Fight Coronavirus. It Can Do The Same For The Climate Crisis (CNN)
Coronavirus And Climate Change: The Pandemic Is A Fire Drill For Our Planet’S Future (NBC NEWS – BIG THINK)