(Mainly from Paul Copan’s “True for You, But not for Me“)
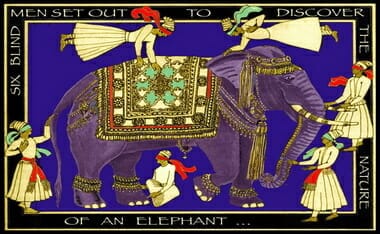
People have used this old parable to share their opinion or viewpoint that no one religion is the only route to God (pluralism). Pluralists believe that the road to God is wide. The opposite of this is that only one religion is really true (exclusivism).
What could a thoughtful person say in response?
- Just because there are many different religious answers and systems doesn’t automatically mean pluralism is correct.
- Simply because there are many political alternatives in the world (monarchy, fascism, communism, democracy, etc.) doesn’t mean that someone growing up in the midst of them is unable to see that some forms of government are better than others.
- That kind of evaluation isn’t arrogant or presumptuous. The same is true of grappling with religion.
- The same line of reasoning applies to the pluralist himself. If the pluralist grew up in Madagascar or medieval France, he would not have been a pluralist!
- If we are culturally conditioned regarding our religious beliefs, then why should the religious pluralist think his view is less arbitrary or conditioned than the exclusivist’s?
- If Christian faith is true, then the Christian would be in a better position than the pluralist to assess the status of other religions
- How does the pluralist know he is correct? Even though he claims others don’t know Ultimate Reality as it really is, he implies that he does. (To say that the Ultimate Reality can’t be known is a statement of knowledge.)
- If the Christian needs to justify Christianity’s claims, the pluralist’s views need just as much substantiation.
If we can’t know Reality as it really is, why think one exists at all? Why not simply try to explain religions as purely human or cultural manifestations without being anything more?
[….]
If you had been born in another country, is it at all likely that you would be a Christian?
Eric looks back at his family—devoutly Christian for four generations in Europe and America, twelve pastors among his relatives, an inner-city schoolteacher and Christian writer for parents—and readily acknowledges that his environment made it easy for him to become a Christian. Still, his faith was exposed to severe challenges as he rose to the top of his university class and as he lived in Asia as a college student. And he knows it took a conscious series of wrenching decisions in his teens and early adult years for him to choose to remain a Christian. Oddly, one of the biggest influences on his faith came from outside his culture through Chinese Christian friends.
John Hick has asserted that in the vast majority of cases, an individual’s religious beliefs will be the conditioned result of his geographical circumstances.1 Statistically speaking, Hick is correct. But what follows from that scenario? We saw in an earlier chapter that the bare fact that individuals hold different views about a thing doesn’t make relativism the inevitable conclusion. Similarly, the phenomenon of varying religious beliefs hardly entails religious pluralism. Before becoming a religious pluralist, an exclusivist has a few equally reasonable options:
- One could continue to accept the religion one grew up with because it has the ring of truth.
- One could reject the view one grew up with and become an adherent to a religion believed to be true.
- One could opt to embrace a less demanding, more convenient religious view.
- One could become a religious skeptic, concluding that, because the process of belief-formation is unreliable, no religion appears to really save.
Why should the view of pluralism be chosen instead of these other options?
An analogy from politics is helpful.2 As with the multiple religious alternatives in the world, there are many political alternatives—monarchy, Fascism, Marxism, or democracy. What if we tell a Marxist or a conservative Republican that if he had been raised in Nazi Germany, he would have belonged to the Hitler Youth? He will probably agree but ask what your point is. What is the point of this analogy? Just because a diversity of political options has existed in the history of the world doesn’t obstruct us from evaluating one political system as superior to its rivals. Just because there have been many political systems and we could have grown up in an alternate, inferior political system doesn’t mean we are arrogant for believing one is simply better.3
Furthermore, when a pluralist asks the question about cultural or religious conditioning, the same line of reasoning applies to the pluralist himself. The pluralist has been just as conditioned as his religious exclusivist counterparts have. Alvin Plantinga comments:
Pluralism isn’t and hasn’t been widely popular in the world at large; if the pluralist had been born in Madagascar, or medieval France, he probably wouldn’t have been a pluralist. Does it follow that he shouldn’t be a pluralist or that his pluralistic beliefs are produced in him by an unreliable belief-producing process? I doubt it.4
If all religions are culturally conditioned responses to the Real, can’t we say that someone like Hick himself has been culturally conditioned to hold a pluralistic view rather than that of an exclusivist? If that is the case, why should Hick’s view be any less arbitrary or accidental than another’s? Why should his perspective be taken as having any more authority than the orthodox Christian’s?
There is another problem: The exclusivist likely believes he has better basis for holding to his views than in becoming a religious pluralist; therefore he is not being arbitrary. John Hick holds that the religious exclusivist is arbitrary: “The arbitrariness of [the exclusivist position] is underlined by the consideration that in the vast majority of cases the religion to which a person adheres depends upon the accidents of birth.”5 But the exclusivist believes he is somehow justified in his position—perhaps the internal witness of the Holy Spirit or a conversion experience that has opened his eyes so that now he sees what his dissenters do not—even if he can’t argue against the views of others. Even if the exclusivist is mistaken, he can’t be accused of arbitrariness. Hick wouldn’t think of his own view as arbitrary, and he should not level this charge against the exclusivist.
A third problem emerges: How does the pluralist know that he is correct? Hick says that the Real is impossible to describe with human words; It transcends all language. But how does Hick know this? And what if the Real chose to disclose Itself to human beings in a particular form (i.e., religion) and not another? Why should the claims of that religion not be taken seriously?6 As Christians, who lay claim to the uniqueness of Christ, we are often challenged to justify this claim—and we rightly should. But the pluralist is also making an assertion that stands in just as much need of verification. He makes a claim about God, truth, the nature of reality. We ought to press the pluralist at this very point: “How do you know you are right? Furthermore, how do you know anything at all about the Ultimate Reality, since you think all human attempts to portray It are inadequate?”7
At this point we see cracks in Hick’s edifice.8 Although Hick claims to have drawn his conclusions about religion from the ground up, one wonders how he could arrive at an unknowable Ultimate Reality. In other words, if the Real is truly unknowable and if there is no common thread running through all the world religions so that we could formulate certain positive statements about It (like whether It is a personal being as opposed to an impersonal principle, monotheistic as opposed to polytheistic, or trinitary as opposed to unitary), then why bother positing Its existence at all? If all that the world religions know about God is what they perceive—not what they know of God as he really is, everything can be adequately explained through the human forms of religion. The Ultimate becomes utterly superfluous. And while It could exist, there is no good reason to think that It does. One could even ask Hick what prevents him from going one step further and saying that religion is wholly human.
Furthermore, when Hick begins at the level of human experience, this approach almost inevitably winds up treating all religions alike. The German theologian Wolfhart Pannenberg writes, “If everything comes down to human experiences, then the obvious conclusion is to treat them all on the same level.”9
In contrast to Hick, the Christian affirms that the knowledge of God depends on his gracious initiative to reveal himself.10 We read in Scripture that the natural order of creation (what we see) actually reveals the eternal power and nature of the unseen God. He has not left himself without a witness in the natural realm (Rom. 1:20; also Acts 14:15–18; 17:24–29; Ps. 19:1). God’s existence and an array of his attributes can be known through his effects. His fingerprints are all over the universe. The medieval theologian-philosopher Thomas Aquinas, for instance, argued in this way: “Hence the existence of God, insofar as it is not self-evident to us, can be demonstrated from those of His effects which are known to us.”11 What we know about God and an overarching moral law in light of his creation, in fact, means we are without excuse (Rom. 2:14–15). (We’ll say more about general revelation in Part IV.) So rather than dismissing the observable world as inadequate, why can’t we say that what we see in the world serves as a pointer toward God?
Thus there is a role for Christian apologetics to play in defending the rationality and plausibility of the Christian revelation.12 This role—especially in the face of conflicting worldviews—shouldn’t be underestimated.13 While Christians should be wary of furnishing arguments as “proofs,” which tend to imply a mathematical certainty, a modest and plausible defense of Christianity—carried out in dependence on God’s Spirit—often provides the mental evidence people need to pursue God with heart, soul, and mind.
Deflating “If You Grew Up in India, You’d Be a Hindu.”
The phenomenon of differing religious beliefs doesn’t automatically entail religious pluralism. There are other options.
Simply because there are many political alternatives in the world (monarchy, Fascism, communism, democracy, etc.) doesn’t mean someone growing up in the midst of them is unable to see that some forms of government are better than others. That kind of evaluation isn’t arrogant or presumptuous. The same is true of grappling with religion.
The same line of reasoning applies to the pluralist himself. If the pluralist grew up in Madagascar or medieval France, he would not have been a pluralist!
If we are culturally conditioned regarding our religious beliefs, then why should the religious pluralist think his view is less arbitrary or conditioned than the exclusivist’s?
If Christian faith is true, then the Christian would be in a better position than the pluralist to assess the status of other religions.
How does the pluralist know he is correct? Even though he claims that others don’t know Ultimate Reality as It really is, he implies that he does. (To say that the Ultimate Reality can’t be known is to make at least one statement of knowledge.)
If the Christian needs to justify Christianity’s claims, the pluralist’s views need just as much substantiation.
If we can’t know Reality as It really is, why think one exists at all? Why not simply try to explain religions as purely human or cultural manifestations without being anything more?
NOTES
1. An Interpretation of Religion, 2.
2. Van Inwagen, ”Non Est Hick,” 213-214.
3. John Hick’s reply to this analogy is inadequate, thus leaving the traditional Christian view open to the charge of arrogance: ”The Church’s claim is not about the relative merits of different political systems, but about the eternal fate of the entire human race” (”The Epistemological Challenge of Religious Pluralism,” Faith and Philosophy 14 [July 1997]: 282). Peter van Inwagen responds by saying that Hick’s accusation is irrelevant to the charge of arrogance. Whether in the political or religious realm, I still must figure out which beliefs to hold among a number of options. So if I adopt a certain set of beliefs, then ”I have to believe that I and those who agree with me are right and that the rest of the world is wrong…. What hangs on one’s accepting a certain set of beliefs, or what follows from their truth, doesn’t enter into the question of whether it is arrogant to accept them” (”A Reply to Professor Hick,” Faith and Philosophy 14 [July 1997]: 299-300).
4. ”Pluralism,” 23-24.
5. This citation is from a personal letter from John Hick to Alvin Plantinga. See Alvin Plantinga’s article, ”Ad Hick,” Faith and Philosophy 14 (July 1997): 295. The critique of Hick in this paragraph is taken from Plantinga’s article in Faith and Philosophy (295-302).
6. D’Costa, “The Impossibility of a Pluralist View of Religions,” 229.
7. Hick has claimed that he does not know but merely presents a ”hypothesis” (see his rather unilluminating essay ”The Possibility of Religious Pluralism,” Religious Studies 33 [1997]: 161-166). However, his claims that exclusivism is ”arbitrary” or has ”morally or religiously revolting” consequences (in More Than One Way?, 246) betrays his certainty.
8. This and the following paragraphs are based on Paul R. Eddy’s argument in ”Religious Pluralism and the Divine,” 470-78.
9. ”Religious Pluralism and Conflicting Truth Claims,” in Gavin D’Costa, ed., Christian Uniqueness Reconsidered: The Myth of a Pluralistic Theology of Religions (Maryknoll, N.Y.: Orbis Books, 1990), 102.
10. On this point, I draw much from D. A. Carson, The Gagging of God, 182-189.
11. Summa Theologiae I.2.3c.
12. Two fine popular-level apologetics books are William Lane Craig, Reasonable Faith (Wheaton, Ill.: Crossway Books, 1994) and J. P. Moreland, Scaling the Secular City (Grand Rapids, Mich.: Baker Book House, 1987). A bit more rigorous but rewarding is Stuart C. Hackett, The Reconstruction of the Christian Revelation Claim (Grand Rapids, Mich.: Baker, 1984). Three other apologetics books worth noting are Peter Kreeft and Ronald K. Tacelli, Handbook of Christian Apologetics (Downers Grove, Ill.: InterVarsity Press, 1994); Norman Geisler, Christian Apologetics (Grand Rapids, Mich.: Baker, 1976); and Winfried Corduan, Reasonable Faith.
13. Some well-meaning Christians have minimized the place of Christian apologetics for a number of reasons. But their reasons, discussed by C. Stephen Evans, tend to be inadequate: (1) ”Human reason has been damaged by sin,” but reason is not worthless, only defective. (2) ”Trying to use general revelation is presumptuous”: Seeking to persuade a person with arguments from general revelation doesn’t assume unassisted and autonomous reason (after all, reason is a gift from God); any such approach ought to rely upon God–just as presenting the gospel message should. (3) ”Natural revelation is unnecessary since special revelation is sufficient”: This argument wrongly assumes that God cannot use the world he created and the reason he gave us to interpret that creation to draw people to himself. (4) ”The arguments for God’s existence aren’t very good”: The Christian apologist should recognize that God has made the world in such a way that if a person is looking for loopholes to avoid God’s existence, he may do so, but it is not due to a lack of evidence. It seems that God would permit evidence for his existence to be resistible and discountable so that humans do not look like utter nitwits if they reject God. There is more to belief than mere intellectual reasons; people often have moral reasons for rejecting God. (See Evans’ fine essay, ”Apologetics in a New Key,” in Craig and McLeod, The Logic of Rational Theism, 65-75.)


 The Matildas were missing several established internationals on Wednesday night, including star striker Kyah Simon. They also rotated players more than usual, which contributed to a lack of cohesion. However, there is no denying losing to a team of school boys is far from ideal preparation for the world’s fifth ranked team in their quest for Olympic gold at Rio. The following is with a H/T to