Inconvenient Truth was one of the videos my kids were forced to watch in school with no counter point or fair response to it. The following documentary was my anecdote to that… however, many parents — if not most — are not aware of resources like these. To wit, I highly recommend one watch the following in it’s entirety:
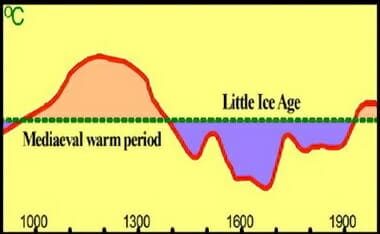
The Great Global Warming Swindle caused controversy in the UK when it premiered March 8, 2007 on British Channel 4. A documentary, by British television producer Martin Durkin, which argues against the virtually unchallenged consensus that global warming is man-made. A statement from the makers of this film asserts that the scientific theory of anthropogenic global warming could very well be “the biggest scam of modern times.” According to Martin Durkin the chief cause of climate change is not human activity but changes in radiation from the sun. Some have called The Great Global Warming Swindle the definitive retort to Al Gore’s An Inconvenient Truth. Using a comprehensive range of evidence it’s claimed that warming over the past 300 years represents a natural recovery from a ‘little ice age’.
According to the program humans do have an effect on climate but it’s infinitesimally small compared with the vast natural forces which are constantly pushing global temperatures this way and that. From melting glaciers and rising sea levels, The Great Global Warming Swindle debunks the myths, and exposes what may well prove to be the darkest chapter in the history of mankind. According to a group of leading scientists brought together by documentary maker Martin Durkin everything you’ve ever been told about global warming is probably untrue. Just as we’ve begun to take it for granted that climate change is a man-made phenomenon, Durkin’s documentary slays the whole premise of global warming.
“Global warming has become a story of huge political significance; environmental activists using scare tactics to further their cause; scientists adding credence to secure billions of dollars in research money; politicians after headlines and a media happy to play along. No-one dares speak against it for risk of being unpopular, losing funds and jeopardizing careers.”
Main contributors to the video:
Professor Tim Ball – Dept. of Climatology – University of Winnepeg, Canada
Professor Nir Shaviv – Institute of Physics – University of Jerusalem, Israel
Professor Ian Clark – Dept. of Earth Sciences – University of Ottawa, Canada
Piers Corbyn, Solar Physicist, Climate Forecaster, Weather Action, UK
Professor John Christy – Dept. of Atmospheric Science – University of Alabama, Huntsville – Lead Author, IPCC (NASA Medal – Exceptional Scientific Achievement)
Professor Philip Stott – Dept of Biogeography – University of London, UK
Al Gore – Former Presidental Candidate
Margaret Thatcher – Global-Warming Promoter
Professor Paul Reiter – IPCC & Pasteur Institute, Paris, France
Professor Richard Lindzen – IPCC & M.I.T.
Patrick Moore – Co-Founder – Greenpeace
Roy Spencer – Weather Satellite Team Leader – NASA
Professor Patrick Michaels – Department of Environmental Sciences – University of Virginia, US
Nigel Calder – Former Editor – New Scientist
James Shikwati – Economist & Author
Lord Lawson of Blaby – Secretary of Energy – UK Parliament Investigator, UK
Professor Syun-Ichi Akasofu – Director, International Arctic Research Centre
Professor Fredrick Singer – Former Director, US National Weather Service
Professor Carl Wunsch – Dept. of Oceanography – M.I.T., Harvard, University College, London, University of Cambridge, UK
Professor Eigil Friis-Christensen – Director, Danish National Space Centre
Listen carefully, very carefully. This is [one of] the most important climate change clip you will ever watch – and only 4mins long. Watch and judge yourself. ABSORB the graph shown. THINK on it. USE your brain.
“For someone to think that 1998 or 2010, or even 2014 are the warmest years… you have to be smoking something.” ~ RPT [Me]
Here are a few evidences — of the many — that indicate it was much warmer in the past and that 2014 wasn’t even near the warmest year [even assuming this to be true!]. The first piece of evidence to show is a recent studies dealing with giant clams.
CLAMS
Clams hold pearls and insights to Earth’s climate history. Two recent studies examining clams and coral samples in the South China Sea suggest the climate was warmer during the Medieval period than during modern times.
Two studies out of the Chinese Academy of Sciences found that the climate was warmer in the Roman and Medieval warm periods than today, despite much lower atmospheric concentrations of carbon dioxide.
“This new paper adds further material to the substantial body of real-world proxy evidence establishing that today’s global temperature is within natural ranges of past changes,” Dr. Hong Yan with the Institute of Earth Environment at the Chinese Academy of Sciences.
Studying giant clams and coral reefs, scientists were able to reconstruct sea surface temperature changes going back 2,500 years. What the clam and coral data show is the Roman and Medieval warming periods impacted East Asia and the western Pacific. The study provides further evidence against the theory that there was little global temperature variation until the 20th century.
Both Chinese studies provide evidence for what is called the Medieval Warm Period, which took place during the late Roman Empire and Middle Ages. The period preceded a time of cooling known as the Little Ice Age…..
Two recent papers, one is in Earth-Science Reviews and the other is in Chinese Science Bulletin, have studied key chemical contents in micro-drilled giant clams shells and coral samples to demonstrate that in the South China Sea the warm period of the Middle Ages was warmer than the present.
The scientists examined surveys of the ratio of strontium to calcium content and heavy oxygen isotopes, both are sensitive recorders of sea surface temperatures past and present. The aragonite bicarbonate of the Tridacna gigas clam-shell is so fine-grained that daily growth-lines are exposed by micro-drilling with an exceptionally fine drill-bit, allowing an exceptionally detailed time-series of sea-temperature changes to be compiled – a feat of detection worthy of Sherlock Holmes himself.
By using overlaps between successive generations of giant clams and corals, the three scientists – Hong Yan of the Institute of Earth Environment, Chinese Academy of Sciences, Willie Soon of the Harvard-Smithsonian Center for Astrophysics and Yuhong Wang of Fudan University, Shanghai – reconstructed a record of sea-surface temperature changes going back 2500 years.
The Roman and Mediaeval Warm Periods both showed up prominently in the western Pacific and East Asia. Sea surface temperatures varied considerably over the 2500-year period.
Changing patterns of winter and summer temperature variation were also detected, disproving the notion that until the warming of the 20th century there had been little change in global temperatures for at least 1000 years, and confirming that – at least in the South China Sea – there is nothing exceptional about today’s temperatures.
Dr. Yan said: “This new paper adds further material to the substantial body of real-world proxy evidence establishing that today’s global temperature is within natural ranges of past changes.” Dr. Soon added: “The UN’s climate panel should never have trusted the claim that the medieval warm period was mainly a European phenomenon. It was clearly warm in South China Sea too.”
Another example is that in the the 1500’s till the late 1800’s passages that are now iced over allowed for what is termed as the Northwest Passage… Exxon or cars weren’t around then?
“If you are like me and bit foggy on the Northwest Passage, here is a five cent refresher. The British coined the term Northwest Passage for the potential northern oceanic pass that would allow vessels to move between the Atlantic and Pacific Oceans. The earliest explorations for the fabled passage were by Cortes in 1539. The late 1500’s were marked by British explorers, Martin Frobisher, Humphrey Gilbert, and John Davis. Several expeditions followed, all with little success of finding the passage but tempered by the acquisition of new lands. Some attempts lead to deaths of entire crews. Notable of these is the Sir John Franklin expedition in which all of the crew members were lost to starvation, scurvy, cannibalism, and lead poisoning from food sealed in tins. The first to transverse the Northwest Passage was Sir Robert McClure using a combination of both sledge and ship. Ironically this was done during the search for Franklin’s team in which McClure’s own ship became trapped in the ice for three winters. The passage was finally conquered entirely by sea by the Norwegian Amundsen in 1906.”
UPDATE
New York Times Mentions by Mistake
(WESTERN JOURNAL) The New York Times ran an editorial Saturday about the effect climate change had on discovering the Northwest Passage that appears to contradict claims the Arctic ice is melting at cataclysmic rates.
Global warming would have helped famed fur trader Alexander Mackenzie discover a Northwest Passage connecting North America to China, according to a NYT editorial from author Brian Castner.
His piece contains one significant caveat: Mackenzie’s 1789 trip happened during an era of above normal ice packed in the North that occurred before widespread fossil fuel use.
“Mackenzie paddled during the Little Ice Age, a few centuries of below-normal cold,” Castner wrote before noting Mackenzie’s failed attempt probably would have been successful had temperatures been at normal ranges.
“If he had undertaken his trip during average conditions, or at our current global temperatures, he would not have been stopped by ice,” he added.
“If the ocean hadn’t been icebound, would the fur trade have followed him down the river to China?
Would a summer Deh Cho have been Canada’s own Mississippi River? Would settlers have wagoned in, a northern Oregon Trail?”…
VIKINGS
Another hint are the Vikings and how they flourished.
Here are some great excerpts from a book[s] on the subject that include Icelandic and Greenlandic Vikings:
The warm climate during the MWP [Medieval Warming Period] allowed this great migration to flourish. Drift ice posed the greatest hazard to sailors but reports of drift ice in old records do not appear until the thirteenth century (Bryson, 1977.)
The Norse peoples traveled to Iceland for a variety of reasons including a search for more land and resources to satisfy a growing population and to escape raiders and harsh rulers. One force behind the movement to Iceland in the ninth century was the ruthlessness of Harald Fairhair, a Norwegian King (Bryson, 1977.)
Vikings travelling to Iceland from Norway during the MWP were probably encouraged by the sight of pastures with sedges and grasses and dwarf woodlands of birch and willow resembling those at home.
Animal bones and other materials collected from archaeological sites reveal Icelandic Vikings had large farmsteads with dairy cattle (a source of meat), pigs, and sheep and goats (for wool, hair, milk, and meat.) Farmsteads also had ample pastures and fields of barley used for the making of beer and these farms were located near bird cliffs (providing meat, eggs, and eiderdown) and inshore fishing grounds. Fishing was primarily done with hand lines or from small boats that did not venture across the horizon (McGovern and Perdikaris, 2000.)
The Greenland Vikings lived mostly on dairy produce and meat, primarily from cows. The vegetable diet of Greenlanders included berries, edible grasses, and seaweed, but these were inadequate even during the best harvests. During the MWP, Greenland’s climate was so cold that cattle breeding and dairy farming could only be carried on in the sheltered fiords. The growing season in Greenland even then was very short. Frost typically occurred in August and the fiords froze in October. Before the year 1300, ships regularly sailed from Norway and other European countries to Greenland bringing with them timber, iron, corn, salt, and other needed items. Trade was by barter. Greenlanders offered butter, cheese, wool, and their frieze cloths, which were greatly sough after in Europe, as well as white and blue fox furs, polar bear skins, walrus and narwhal tusks, and walrus skins. In fact, two Greenland items in particular were prized by Europeans: white bears and the white falcon. These items were given as royal gifts. For instance, the King of Norway-Denmark sent a number of Greenland falcons as a gift to the King of Portugal, and received in return the gift of a cargo of wine (Stefansson, 1966.) Because of the shortage of adequate vegetables and cereal grains, and a shortage of timber to make ships, the trade link to Iceland and Europe was vital (Hermann, 1954.)
THE SUN
To support the sun being involved, here is another short video:
Another example of this warming comes from the production of wine and the trading boom and crop and animal growth and productivity during this medieval warming period in the Roman Empire. Vineyards on the Salisbury Plains, and other parts on England that wopuld be impossible today:
Farmers and peasants in medieval England launched a thriving wine industry south of Manchester. Good wines demand warm springs free of frosts, substantial summer warmth and sunshine without too much rain, and sunny days in the fall. Winters cannot be too cold — not below zero Fahrenheit for any significant period. The northern limit for grapes during the Middle Ages was about 300 miles above the current commercial wine areas in France and Germany. These wines were not simply marginal supplies, but of sufficient quality and quantity that, after the Norman conquest, the French monarchy tried to prohibit British wine production.
TREES
And my final example, one I used in a more layman way with high school students at West Ranch High School was the following. I have wanted to get this copied and up for a long time, and I have the time now. But for the tree lovers, the following will be new information to them surely… and note how the 1990 IPCC graph at the top of this post matches the Chinese one below. This much warmer weather/climate (by three[+] degrees) allowed for higher tree lines in the past:
…3-Degrees Warmer
Tree rings can be counted to date the time of an event, and their summertime width is greater under good growing conditions (warmth, rainfall) than during poor growing seasons (cold, dry). They are limited by the distance back in time researchers can find live trees, dead trees, or buried wood from an earlier time which can be accurately dated to its growth period.
In mountainous northwestern Pakistan, more than 200,000 tree-ring measurements were assembled from 384 long-lived trees that grew on more than twenty individual sites. The 1,300-year temperature proxy shows the warmest decades occurred between 800 and 1000, and the coldest periods between 1500 and 1700.128
Mountain tree line elevations are another sensitive and highly accurate proxy for temperature change. A number of studies of European tree lines testify to the fact that tree lines, farming, and villages moved upslope during the Medieval Warming and back with the Little Ice Age.
A recent study of tree line dynamics in Western Siberia showed that advances in tree lines during the warmer weather of the 20th century were “part of a long-term reforestation of tundra environments.” Two Swiss scientists, Jan Esper and Fritz-Hans Schweingruber, note that “stumps and logs of Larix sibirica can be preserved for hundreds of years” and that “above the tree line in the Polar Urals such relict material from large, upright trees were sampled and dated, confirming the existence, around A.D. 1000, of a forest tree line 30 meters above the late 20th century limit.” They also note, “this previous forest limit receded around 1350, perhaps caused by a general cooling trend.” Thus, the Siberian tree lines testify to the Medieval Warming and the Little Ice Age well outside of Europe.129
Lisa J. Graumlich of Montana State University combined both tree rings and tree lines to assess past climate changes in California’s Sierra Nevada. The trees in the mountains’ upper tree lines are preserved in place, living and dead, for up to 3,000 years. Graumlich says:
A relatively dense forest grew above the current tree line from the beginning of our records to around 100 B.C., and again from A.D. 400 to 1000, when temperatures were warm. Abundance of trees and elevation of tree line declined very rapidly from A.D. 1000 to 1400, the period of severe, multi-decadal droughts. Tree lines declined more slowly from 1500 to 1900 under the cool temperatures of the Little Ice Age, reaching current elevations around 1900.130
Graumlich’s tree evidence confirms both of the last two 1,500-year cycles: the Roman Warming/Dark Ages climate cycle and the Medieval Warming/Little Ice Age. Severe drought, which has been documented in California during the latter part of the Medieval Warming, obscured the timing of the shift from the Medieval Warming to the Little Ice Age. However, both events were clearly evident.
Cave stalagmite cores confirm the global nature of the 1,500-year cycle found in ice cores, seabed sediments, and trees. Their carbon and oxygen isotopes and their trace element content vary with temperature. Moreover, the stalagmites go back further in time than the tree evidence. One German stalagmite goes back more than 17,000 years. Cave stalagmites have been found in Ireland, Germany, Oman, and South Africa whose layers all show the Little Ice Age, the Medieval Warming, the Dark Ages, and the Roman Warming.131 A number of the stalagmites also show the unnamed cold period that preceded the Roman Warming.
In southern Ontario, pollen shows that the warmth-loving beech trees of the Medieval Warming gradually gave way to cold tolerant oaks as the Little Ice Age came on—and then the forest became dominated by pine trees. The oak trees have been making a comeback in Ontario since 1850 and the beech trees can be expected to resurge as the Modern Warming continues in the centuries ahead.132
Remains of prehistoric villages in Argentina were analyzed by Marcela A. Cioccale of the National University of Cordoba to determine where Argentina’s native peoples lived over the past 1,400 years. Using carbon-14 dating, she found that the inhabitants clustered in the lower valleys during the Dark Ages period, and then moved higher up the slopes as the Medieval Warming brought “a marked increase of environmental suitability, under a relatively homogeneous climate.”133 Habitation moved up as high as 4,300 meters in the Central Peruvian Andes around 1000 as the Medieval Warming not only raised temperatures but created more stable conditions for farming. After 1320, people migrated back down the slopes as the colder, less stable climate of the Little Ice Age set in.
Yang Bao of the Chinese Academy of Sciences reconstructed China’s temperature history for the last 2,000 years from ice cores, lake sediments, peat bogs, tree rings, and the historic documents that date back farther in China than in any other country. He found China had its highest temperature during the second and third centuries, toward the end of the Roman Warming. China’s climate was also warm from 800 to 1400, cold from 1400 to 1920, and then began to warm again after 1920.134(See Figure 4.1.)
Figure 4.1: 2,000 Years of Chinese Temperature History
Source [for above figure]: Y. T. Hong et al., “Response of Climate to Solar Forcing Recorded in a 6,000-Year Time-Series of Chinese Peat Cellulose,” The Holocene 10 (2000): 1-7.
[128] J. Esper et al., “1,300 Years of Climate History for Western Central Asia Inferred from Tree Rings,” The Holocene 12 (2002): 267-77.
[129] J. Esper and F. H. Schweingruber, “Large-Scale Tree Line Changes Recorded in Siberia,” Geophysical Research Letters 31 (2004): 10.1029/2003GLO019178.
[130]L. J. Graumlich, “Global Change in Wilderness Areas: Disentangling Natural and Anthropogenic Changes,” U. S. Department of Agriculture Forest Service Proceedings RMRS-P-15-Vol. 3, 2000
[131] F. McDermott et al., “Centennial-Scale Holocene Climate Variability Revealed by a High-Resolution Speleothem 018 Record from SW Ireland,” Science 294 (2001): 1328-331; S. Niggemann et al., “A Paleoclimate Record of the Last 17,600 Years in Stalagmites from the B7 Cave, Sauerland, Germany,” Quaternary Science Reviews 22 (2003): 555-67; U. Neff et. al., “Strong Coherence between Solar Variability and the Monsoon in Oman between 9 and 6 kyr ago,” Nature 411 (2001): 290-93; and Tyson et al., “The Little Ice Age and Medieval Warming in South Africa,” South African Journal of Science 96, no. 3 (2000).
[132] I. D. Campbell and J. H. McAndrews, “Forest Disequilibrium Caused by Rapid Little Ice Age Cooling,” Nature 366 (1993): 336-38
[133] M. A. Cioccale, “Climatic fluctuations in the Central Region of Argentina in the last 1000 years,” Quaternary International 62, (1999): 35-47.
[134] Yang Bao et al., “General Characteristics of Temperature Variation in China during the Last Two Millennia,” Geophysical Research Letters 10 (2002): 1029/2001GLO014485.
S. Fred Singer and Dennis T. Avery, Unstoppable Global Warming: Every 1,500 Years (Blue Ridge Summit, PA: Rowman & Littlefield, 2007), 63-66.
SOME MORE TREE EVIDENCES:
Greta’s Thunberg’s Northern Sweden Was 3°C Warmer 9300 Years Ago…Trees once grew where tundra is today:
9300-year old vegetation remnants found under receding glaciers in Northern Sweden show that the trees once grew where tundra exists today, meaning it was warmer (NO TRICK ZONE)
Over the past 120 years the climate has warmed, and so there’s been glacier and ice patch shrinkage. This has unveiled earlier vegetation and life.
The concerned vegetational remnants that were found represent tree exclaves in ice-empty glacier cirques, the study says.
Found were megafossils of pinus sylvestris with signs of being gnawed by beaver (Castor fiber L.) from different sites in northern Sweden which today are tundra.
They age 9500-9300 cal. yr BP and are located 400-700 m above present-day tree lines.
[….]
These exposed megafossil remnants represent former tree stands that were later on extirpated and entombed by snow and ice for many millennia. At -0.6°C/100 m lapse rate, it means it was then over 3°C warmer than now in this region at a time when atmospheric CO2 concentrations were well below 300 ppm.
For a great interactive map one should see this link embedded in the below graphic, after the excerpt from WUWT. The full (translated to english) study can be found HERE….
MISC. EVIDENCES
The idea of a medieval warm period was formulated for the first time in 1965 by the English climatologist Hubert H. Lamb[1]. Lamb, who founded the UK Climate Research Unit (CRU) in 1971, saw the peak of the warming period from 1000 to 1300, i.e. in the High Middle Ages. He estimated that temperatures then were 1-2 ° C above the normal period of 1931-1960. In the high North, it was even up to 4 degrees warmer. The regular voyages of the Vikings between Iceland and Greenland were rarely hindered by ice, and many burial places of the Vikings in Greenland still lie in the permafrost.
Glaciers were smaller than today
Also the global retreat of glaciers that occurred in the period between about 900 to 1300[2] speaks for the existence of the Medieval Warm Period. An interesting detail is that many glaciers pulling back since 1850 reveal plant remnants from the Middle Ages, which is a clear proof that the extent of the glaciers at that time was lower than today[3].
Furthermore, historical traditions show evidence of unusual warmth at this time. Years around 1180 brought the warmest winter decade ever known. In January 1186/87, the trees were in bloom near Strasbourg. And even earlier you come across a longer heat phase, roughly between 1021 and 1040. The summer of 1130 was so dry that you could wade through the river Rhine. In 1135, the Danube flow was so low that people could cross it on foot. This fact has been exploited to create foundation stones for the bridge in Regensburg this year[4].
Clear evidence of the warm phase of the Middle Ages can also be found in the limits of crop cultivation. The treeline in the Alps climbed to 2000 meters, higher than current levels are[5]. Winery was possible in Germany at the Rhine and Mosel up to 200 meters above the present limits, in Pomerania, East Prussia, England and southern Scotland, and in southern Norway, therefore, much farther north than is the case today[6]. On the basis of pollen record there is evidence that during the Middle Ages, right up to Trondheim in Norway, wheat was grown and until nearly the 70th parallel/latitude barley was cultivated[4]. In many parts of the UK arable land reached heights that were never reached again later.
Also in Asia historical sources report that the margin of cultivation of citrus fruits was never as far north as in the 13th century. Accordingly, it must have been warmer at the time about 1 ° C than today[7].
Archeology and history confirm interglacial
Insects can also be used as historical markers for climate. The cold sensitive beetle Heterogaster urticae was detected during the Roman Optimum and during the Norman High Middle Age in York. Despite the warming of the 20th century, this beetle is found today only in sunny locations in the south of England[8].
During the medieval climate optimum, the population of Europe reached hitherto unknown highs. Many cities were founded at this very time with high-altitude valleys, high pastures and cultivated areas, which were at the beginning of the Little Ice Age again largely abandoned[9].
The Middle Ages was the era of high culture of the Vikings. In this period their expansion occurred into present-day Russia and the settlement of Iceland, Greenland and parts of Canada and Newfoundland. In Greenland even cereals were grown about this time.. With the end of the Medieval Warm Period the heyday of the Vikings ended. The settlements in Greenland had to be abandoned as well as in the home country of Norway, during this time, many northern communities located at higher altitudes[10]. The history of the Vikings also corresponds very well to the temperature reconstructions from Greenland, which were carried out using ice cores. According to the reconstructions, Greenland was at the time of the Vikings at least one degree warmer than in the modern warming period[11].
[1]Hubert H. Lamb, The Early Medieval Warm Epoch and Its Sequel, in Paleogeography, Paleoclimatology, Paleoecology 1 (1965) 13-37
Here is a 2014 Google FLASHBACKwhere sanity prevailed a bit — note, I will end with it as well:
We came to the conclusion that even if Google and others had led the way toward a wholesale adoption of renewable energy, that switch would not have resulted in significant reductions of carbon dioxide emissions. Trying to combat climate change exclusively with today’s renewable energy technologies simply won’t work; we need a fundamentally different approach.
[….]
“Even if one were to electrify all of transport, industry, heating and so on, so much renewable generation and balancing/storage equipment would be needed to power it that astronomical new requirements for steel, concrete, copper, glass, carbon fibre, neodymium, shipping and haulage etc etc would appear. All these things are made using mammoth amounts of energy: far from achieving massive energy savings, which most plans for a renewables future rely on implicitly, we would wind up needing far more energy, which would mean even more vast renewables farms – and even more materials and energy to make and maintain them and so on. The scale of the building would be like nothing ever attempted by the human race.”
Google Joins the Common Sense Crew On Renewable Energies – Finally! (RPT)
POWERLINE!
I will add an older post below this excellent POWERLINE blogpost:
Liberals tell us that we are in the midst of a transition from fossil fuels to wind and solar energy. The reality is that no such transition is taking place, nor will it. This video by Professor Simon Michaux, who doesn’t take issue with global warming hype, explains one of several reasons why this is true: the mineral requirements of a wind- and solar-based energy system can’t possibly be met.
This description accompanies the YouTube video:
The quantity of metal required to make just one generation of renewable tech units to replace fossil fuels, is much larger than first thought. Current mining production of these metals is not even close to meeting demand. Current reported mineral reserves are also not enough in size. Most concerning is copper as one of the flagged shortfalls.
Before the video, here are a few screenshots from it. This one shows the principal metals needed for a wind and solar energy system, and compares those requirements with actual production of those commodities as of 2019, the last “normal” pre-covid year. Note that 189 years worth of copper production, 400 years of nickel production, 9,921 years of lithium production, 1,733 years of cobalt production, 29,113 years of germanium production, and so on, would be needed for the first 20 years of wind and solar installations. Then we would have to do it all over again. Talk about a lack of sustainability!
This chart looks at known global reserves of key minerals, as a percentage of what would be needed to replace fossil fuels. Note, for example, that known lithium reserves amount to less than 3% of what would be needed to replace fossil fuels with wind, solar and batteries, for the first 20 years. Known cobalt reserves amount to less than 4% of what would be needed for the first generation, and so on. Keep in mind, too, that mining projects typically take something like 20 years to come on line. Longer, if the environmentalists get their way.
[….]
Another point that is often overlooked is that mining companies exploit the lowest-cost minerals first–those that are most plentiful and easiest to extract. If demand increases exponentially, then much more expensive sources will be brought into play. This means that the cost of basic minerals like copper, nickel, cobalt and so on will skyrocket as demand increases, perhaps by orders of magnitude. I don’t think anyone has even attempted to assess the full cost of a “green” energy system when those price increases are taken into account.
In an excellent post linking to a German documentary (30-minutes) and study showing the devastation to Chili of lithium mining, we find the following:
German ZDF public television recently broadcast a reportshowing how electric cars are a far cry from being what they are all cracked up to be by green activists.
The report titled: “Batteries in twilight – The dark side of e-mobility” [now not available] shows how the mining of raw materials needed for producing the massive automobile batteries is highly destructive to the environment. For example, two thirds of the cobalt currently comes from the Congo, where the mining rights have been acquired by China. Other materials needed include manganese, lithium and graphite.
Every electric car battery needs about 20 – 30 kg of lithium.
The mining of the raw materials often takes place in third world countries where workers are forced to work under horrendous conditions and no regard is given to protecting the environment. When it comes to “going green”, it seems everything flies out the window….
The production of lithium through evaporation ponds uses a lot of water – around 21 million litres per day. Approximately 2.2 million litres of water is needed to produce one ton of lithium. (EURO NEWS)
AGAIN… here is a Facebookpost of the same thing regarding Lithium Fields:
This is a Lithium leach field.
This is what your Electric Car batteries are made of.
It is so neuro-toxic that a bird landing on this stuff dies in minutes.
Take a guess what it does to your nervous system?
Pat yourself on the back for saving the environment.
Chile, 2nd largest lithium producer, is having water-scarcity problems as this technology takes so much water to produce battery-grade lithium. 2000 tons: 1 ton.
And the current version of the “inflation reduction act” wants 100% of EV battery components produced in the US.
Lead, nickel, lithium, cadmium, alkaline, mercury and nickel metal hydride.
Batteries are a collection of things that are extremely deadly.
Alternative fuels/energy is a DIRTY BUSINESS… but the left who live in the seclusion of the New York Times and MSNBC would never know this. I can show a graph showing skyrocketing carbon emissions worldwide for the past decade and that the temperature has dropped during this time by a small amount, and it is like showing them instructions to build an IKEA bookcase with instructions written in Gaelic!
“Giga Factories” vs. Fossil Fuels | Mark Mills
Our nations Utility batteries and car batteries can only store two hours worth of our nations electricity needs. We have an estimated 1 million electric cars in use in the United States. But what goes into building an electric vehicle. How much fossil fuel is needed, and how much environmental damage is done, extracting the rare earth minerals needed to power an electric vehicle? The answer will surprise you. And prove the Electric car is not the savior for our energy woes.
MINING FOR MINERALS/METALS
What about the impact and supply of the materials needed to produce batteries? TreeHugger has a good post that mentions some of these environmental pitfalls. These issues involve many devices we use daily (cell phones, lap-top computers, rechargeable batteries, etc.), but add to this burden a mandated or subsidized car industry:
…lithium batteries take a tremendous amount of copper and aluminum to work properly. These metals are needed for the production of the anode & the cathode, cables and battery management systems. Copper and aluminum have to be mined, processes and manufacturing which takes lots of energy, chemicals and water which add to their environmental burden.
[….]
First of all, this study emphasizes that there would be less Lithium available than previously estimated for the global electric car market. It also states the fact that some of the largest concentrations of Lithium in the world are found in some of the most beautiful and ecologically fragile places, such as The Salar de Uyuni in Bolivia. The authors note:
“It would be irresponsible to despoil these regions for a material which can only ever be produced in sufficient quantities to serve a niche market of luxury vehicles for the top end of the market. We live in an age of Environmental Responsibility where the folly of the last two hundred years of despoilment of the Earth’s resources are clear to see. We cannot have “Green Cars” that have been produced at the expense of some of the world’s last unspoiled and irreplaceable wilderness. We have a responsibility to rectify our errors and not fall into the same traps as in the past.”
[….]
The report estimates that there would be less Lithium available than previously estimated for the global electric car market, as demand is rising for competing markets, such as cellular telephones and other electronic devices. At the same time, due to a great concentration of Lithium found in Chile, Bolivia and Argentina (70% of the world’s deposits), the United States and other developed countries needing the material will be subject to geopolitical forces similar to those they have already encountered from the member countries of OPEC…
Click HERE to go to larger file (use mouse wheel to zoom in)
In an excellent article we see the projected demands on other metals involved in the battery and transit goals:
….Regarding the demand for the different minerals, in the case of aluminum, according to our results, the demand for minerals from the rest of the economy would stand out, with the requirement for batteries having little influence. Copper would have a high demand from the rest of the economy, but it would also have a significant demand from vehicles, infrastructure and batteries. Cobalt would be in high demand because of the manufacture of batteries with the exception of the LFP battery that does not have this mineral, in the case of its demand from the rest of the economy it can be stated that it would be important but less influential than the demand for batteries. Lithium would have very high requirements from all the batteries and with a reduced demand from the rest of the economy. Manganese would have an important but contained demand coming from LMO and NMC batteries, since the requirements for this mineral would stand out in the rest of the economy. Finally, nickel would have a high demand from NMC and NCA batteries, but its main demand would come from the rest of the economy.
The batteries that would require the least materials are the NCA and LFP batteries. The NMC battery has been surpassed in performance and mineral usage by the NCA. The LiMnO2 battery has a very poor performance, so it has been doomed to disuse in electric vehicles. In addition, the LFP battery, the only one that does not use critical materials in the cathode (other than lithium), also has poor performance, requiring very large batteries (in size and weight) to match the capacity and power of batteries using cobalt.
Charging infrastructure, rail and copper used in electrified vehicles could add up to more than 17% of the copper reserve requirement in the most unfavourable scenario (high EV) and 7% in the most favourable (degrowth), so these are elements that must be taken into account…..
Are Electric Vehicles really clean? | They run on dirty energy and blood of children as young as 6. | Electric cars drive human rights abuse and child labour. | China is one of the villains in this story. | Are electric carmakers equally guilty too? | Palki Sharma Upadhyay tells you.
TO MAKE MATTERS WORSE….
…. lithium is also not the only battery ingredient with a dark side. Perhaps the darkest of all is cobalt, which is commonly used, alongside lithium, in the batteries of many electric vehicles.
Worse still, UNICEF estimates 40,000 of the workers in these mines are children under the age of 18, with some as young as 7 years old. Cobalt mining also comes with serious health risks. Chronic exposure to dust containing cobalt can cause the potentially fatal lung disease “hard metal lung disease.” Many fatal accidents have also been caused by mines not being constructed or managed safely.
Clearly then, in the face of such widespread environmental damage and human rights abuses, the ethics of electric vehicles is far more complicated than the expensive car adverts and glowing newspaper headlines would have us believe…..
You Dig Up 500,000 Pounds of the Earth’s Crust for One EV Auto Battery! And each of these half a million pounds of earth are dug up with a diesel engine. A typical EV battery weighs one thousand pounds, about the size of a travel trunk. It contains twenty-five pounds of lithium, sixty pounds of nickel, 44 pounds of manganese, 30 pounds cobalt, 200 pounds of copper, and 400 pounds of aluminum, steel, and plastic. Inside are over 6,000 individual lithium-ion cells. To manufacture each EV auto battery, you must process 25,000 pounds of brine for the lithium, 30,000 pounds of ore for the cobalt, 5,000 pounds of ore for the nickel, and 25,000 pounds of ore for copper. All told, you dig up 500,000 pounds of the earth’s crust for one battery.” (NATIONAL REVIEW – AUSTRALIA)
LAND NEEDED
“the plausible path to decarbonization, modeled by researchers at Princeton, sees wind and solar using up to 590,000 square kilometers — which is roughly equal to the land mass of Connecticut, Illinois, Indiana, Kentucky, Massachusetts, Ohio, Rhode Island and Tennessee put together. The footprint is big.” — Ezra Klein in the New York Times.
Why were federal tax subsidies extended for wind and solar by Congress? Again. For the umpteenth time! We are against subsidies because they distort markets. Those politicians who support these market-distorting policies should at least be forced to answer the question: “How much is enough?” Taxpayers have been subsidizing wind and solar corporations for more than 40 years! These companies have gotten fat and happy on your money, and Congress keeps giving them more of it. This video is based on a Texas Public Policy Foundation report that explains why it’s long past time to stop wind and solar from stuffing their bank accounts with your tax dollars.
To give you a sense of scale, to replace the energy from one average natural gas well, which sits on about four acres of land, would require 2,500 acres of wind turbines. That is a massive amount of land. You would have to cover this entire nation with wind turbines in an attempt to replace the electricity that we generate from coal, natural gas, and nuclear power, and even that would not get the job done. (CFACT)
At his international climate summit in April, President Joe Biden vowed to cut U.S. greenhouse gas emissions in half by 2030. The goal will require sweeping changes in the power generation, transportation and manufacturing sectors. It will also require a lot of land.
Wind farms, solar installations and other forms of clean power tend to take up more space on a per-watt basis than their fossil-fuel-burning brethren. A 200-megawatt wind farm, for instance, might require spreading turbines over 13 square miles (36 square kilometres). A natural-gas power plant with that same generating capacity could fit onto a single city block.
Achieving Biden’s goal will require aggressively building more wind and solar farms, in many cases combined with giant batteries. To fulfill his vision of an emission-free grid by 2035, the U.S. needs to increase its carbon-free capacity by at least 150%. Expanding wind and solar by 10% annually until 2030 would require a chunk of land equal to the state of South Dakota, according to Princeton University estimates and an analysis by Bloomberg News. By 2050, when Biden wants the entire economy to be carbon free, the U.S. would need up to four additional South Dakotas to develop enough clean power to run all the electric vehicles, factories and more.
WRECKING OUR PLANET TO SAVE IT
Earth Day 2021 is April 22nd. Therefore, eco-activist groups will be preaching the gospel of wind & solar power and the importance of biodiversity. What those trying to “save the planet” fail to understand (or more likely ignore) is that these two priorities are in direct conflict. Wind & solar require far more land than nuclear, natural gas and coal power. They are also far more destructive to regions of high biodiversity as well as large birds, bats and endangered species. As we celebrate Earth Day, let’s consider the significant environmental consequences of attempting to provide electricity through low density, unreliable sunshine and breezes.
Vice President Joe Biden aims to be the most progressive president on the issue of climate change. The man who spent most of 2020 hiding in the basement believes the future of energy is renewable energy like wind and solar. Biden should go back to the basement, watch Michael Moore’s “Planet of the Humans,” and rethink his advocacy for renewable energy. Wind and solar are not the answer, and the idea of converting our fossil fuel-based economy into renewables could be a devastating take-down to society.
What It Would Really Take to Reverse Climate Change: Today’s renewable energy technologies won’t save us. So what will? (SPETRUM)
Shocker: Top Google Engineers Say Renewable Energy ‘Simply won’t work’ (WATTS UP WITH THAT)
Polluting the Beauty and Cleanliness Of Our World With Renewable Energy (RPT)
Wind and Solar More Harmful To Environment Than Helpful (RPT)
FLASHBACK
What It Would Really Take to Reverse Climate Change: Today’s renewable energy technologies won’t save us. So what will? (SPETRUM)
Shocker: Top Google Engineers Say Renewable Energy ‘Simply won’t work’ (WATTS UP WITH THAT)
Polluting the Beauty and Cleanliness Of Our World With Renewable Energy (RPT)
Wind and Solar More Harmful To Environment Than Helpful (RPT)
So it seems that these more left leaning environmentalists think it is okay to spend billions of tax-payer money and regulate businesses on ideas that do not work anywhere but in Utopian dreams. Let’s end with WUWT quoting these Google Ph.D.s and then segue out with commentary:
“Even if one were to electrify all of transport, industry, heating and so on, so much renewable generation and balancing/storage equipment would be needed to power it that astronomical new requirements for steel, concrete, copper, glass, carbon fibre, neodymium, shipping and haulage etc etc would appear. All these things are made using mammoth amounts of energy: far from achieving massive energy savings, which most plans for a renewables future rely on implicitly, we would wind up needing far more energy, which would mean even more vast renewables farms – and even more materials and energy to make and maintain them and so on. The scale of the building would be like nothing ever attempted by the human race.”
I must say I’m personally surprised at the conclusion of this study. I genuinely thought that we were maybe a few solar innovations and battery technology breakthroughs away from truly viable solar power. But if this study is to be believed, solar and other renewables will never in the foreseeable future deliver meaningful amounts of energy.
Apple as well is struggling with it’s Utopian — only works on paper — dreams.
POWERLINEnotes that “yesterday’s Wall Street Journalstory about the production difficulties of the Arizona supplier that Apple selected to make sapphire screens for the iPhone 6 was fascinating in its own right, but there was one little detail in the story that zipped by too quickly.” Continuing they quote the WSJ:
Mr. Squiller, the GT operations chief, told the bankruptcy court that GT lost three months of production to power outages and delays building the facility.
Whoa, slow down there a moment: what’s this about power outages? I’d sure like to know more of the full story here. Was this simply bad engineering on site, or was there a problem with the local grid or the energy sources supplying the grid in that area? Grid stability is going to be a more serious issue going forward as we compel more and more “renewable” (meaning “less stable”) energy as part of the EPA’s mania to restructure the electricity sector through the Clean Air Act.
RACISM CAUSES THIS: Of course the left thinks this “okay” symbol is racist, like everything is now “racist” (milk, the term “athletic,” criticizing the IRS, saying that Barack Obama lied, wanting lower taxes, Star Wars, your baby, craft beer, being white, lunch bags, etc., etc. —TOWNHALL| TWITTER[Tucker Carlson] | WASHINGTON TIMES) | NATIONAL REVIEW| ZERO HEDGE [Tucker Carlson]). See, of course, my previous posts on the “okay” symbol, hereand here.
The following is one of the reasons I reject Darwinian evolution (and, frankly, conspiracy theories like WTC-7 being a conspiracy), and any scientist would reject anything for.
“Insofar as a scientific statement speaks about reality, it must be falsifiable: and insofar as it is not falsifiable, it does not speak about reality.”
K.R. Popper, The Logic of Scientific Discovery (London, England: Hutchinson & Co, 1959), 316; found in, Werner Gitt, Did God Use Evolution?Observations from a Scientist of Faith (Portland, OR: Master Books, 2006), 11. (See also: SCIENCE AS FALSIFICATION)
That is to say, if a theory explains everything it explains nothing:
This info is with a hat-tip [and excerpt] to CLIMATE DEPOT. Here is the headline of an article to give you a flavor of the new debate:
I will include CLIMATE DEPOT’S article dump at the end. However, I wanted to add the excerpt from Marc Morano’s book he posted, here — regarding snowfall:
Book Excerpt: Back in 2000, when it was still “global warming,” David Viner, a senior research scientist at the climatic research unit (CRU) of the University of East Anglia (the institution that would be at the epicenter of Climategate), was featured in a news article in the UK newspaper the Independent with the headline, “Snowfalls are now just a thing of the past.” Viner predicted that within a few years winter snowfall would become “a very rare and exciting event. Children just aren’t going to know what snow is.”
So the trick of the “Global Warmers” is to define reality to fit their premise… no matter what.
Another researcher, David Parker, of the UK’s Hadley Centre for Climate Prediction and Research, even went as far as to predict that British children would have only “virtual” experience of snow via films and the Internet.
The predictions of less snow by global warming scientists were ubiquitous—and dead wrong. The current decade, from 2010 forward, is now the snowiest decade ever recorded for the U.S. East Coast, according to meteorologist Joe D’Aleo. Talk about an inconvenient truth.
How did the warmist scientists explain record snow after they had predicted less snow? Easy. More snow is now caused by “climate change.” By 2013, after “global warming” had become “climate change,” snow at unusual times was evidence for the supposed man-made crisis. Senator Barbara Boxer, the chair of the Senate Environment and Public Works Committee claimed. “Yeah, it’s gonna get hot, but you’re also gonna to have snow in the summer in some places.”
Boxer seems to think any weather event can be made to fit the climate change narrative.Environmentalist George Monbiot had already tried to explain away the then record cold and snow in a column titled, “That snow outside is what global warming looks like.” Monbiot did his best to square the circle: “I can already hear the howls of execration: now you’re claiming that this cooling is the result of warming! Well, yes, it could be.” Monbiot asked, “So why wasn’t this predicted by climate scientists? Actually, it was, and we missed it.”
We missed it? Predictions of less snow were ubiquitous by global warming scientists. But once that prediction failed to come true, the opposite of what they predicted instead became—what they expected. How did global warming scientists explain record snow after prediction less snow? Easy. More snow is now caused by global warming.“Snow is consistent with global warming, say scientists” blared a UK Telegraph headline in 2009. The FinancialTimes tried to explain “Why global warming means…more snow” in 2012.
The December 26, 2010, New York Times featured an op-ed with the headline “Bundle Up, It’s Global Warming,” claiming, “Overall warming of the atmosphere is actually creating cold-weather extremes.” Even former Vice President Al Gore, who had claimed in his Oscar-winning film in 2006 that all the snow on Mount Kilimanjaro would melt “within the decade,” got into the act. Never once in An Inconvenient Truth had Gore warned of record cold and increasing snowfalls as a consequence of man-made global warming. As late as 2009, the Environmental News Service was reporting on Gore’s hyping the lack of snow as evidence for man-made global warming: “Gore Reports Snow and Ice Across the World Vanishing Quickly.”
But then, after massive snowstorms hit the United States in 2010, Gore claimed that “increased heavy snowfalls are completely consistent with…man-made global warming.” UN IPCC lead author and Princeton University physicist Michael Oppenheimer had also exploited years of low snowfall totals to drive home the global warming narrative. He was quoted in a 2000 New York Times article: “‘I bought a sled in ’96 for my daughter,’ said Michael Oppenheimer, a scientist at the nonprofit Environmental Defense Fund. ‘It’s been sitting in the stairwell and hasn’t been used. I used to go sledding all the time. It’s one of my most vivid and pleasant memories as a kid, hauling the sled out to Cunningham Park in Queens.’… Dr. Oppenheimer, among other ecologists, points to global warming as perhaps the most significant long-term factor” explaining why, in the words of the New York Times reporter, “Sledding and snowball fights are as out-of-date as hoop-rolling.”
When I confronted Oppenheimer about his sled comment following his appearance at a 2014 Congressional hearing, my interview was cut short. I asked, “In 2000 New York Times, you mentioned you bought your daughter a sled, but she hadn’t been able to use it…”
Oppenheimer’s aide intervened to say, “I’m sorry, but Dr. Oppenheimer has to testify.”
He Got the MemoNBC weatherman Al Roker obviously got the “climate change” memo. “This is global warming even though it’s freezing?” Larry King asked Roker in 2015.“Right, well, that’s why I don’t like the phrase ‘Global Warming.’ I like ‘Climate Change,’” the weatherman explained.The message went from global warming causes less snow to climate change causes more snow.
“So Boston at this point, is in number two snowiest winter,” Larry King asked just before Boston broke the record for it snowiest winter on record, in 2015. “Is this all part of Climate change?” Roker did not flinch. “I think it is,” he answered.
So no matter what happens, the activists can claim with confidence the event was a predicted consequence of global warming. There is now no way to ever falsify global warming claims.
2019: UN IPCC’s Kevin Trenberth rebukes fellow warmists on polar vortex claims! ‘Frankly, it is a stretch to make that link…this is in realm of weather — Not climate’– “Frankly, it is a stretch to make that link,” Kevin Trenberth, a climate scientist at the National Center for Atmospheric Research, told The Daily Caller News Foundation on Tuesday. “There is always cold air over the Arctic in the polar night and the question is whether it sits there or breaks out,” Trenberth said. “So all this is in realm of weather. Not climate.” … “‘Climate change’ once referred to outcomes measured via statistics (‘detection’) tracked over decades,” University of Colorado professor Roger Pielke Jr. noted Wednesday on Twitter. “Today ‘climate change’ is most often used as a causal factor in attributing events over hours, days or weeks,” Pielke said. “We’ve become dumber.”
(Hat-tip to Heisenberg’s Revenge via ACE OF SPADES) In this updated “Fact Check” video from the Climate Discussion Nexus, Dr. John Robson investigates the unsound origins and fundamental inaccuracy, even dishonesty, of the claim that 97% of scientists, or “the world’s scientists”, or something agree that climate change is man-made, urgent and dangerous.
THE PIPELINE!….Here’s an excerpt, which examines the sleight of hand at the heart of the “97 percent” claim:
In 2009, a pair of researchers at the University of Illinois sent an online survey to over 10,000 Earth scientists asking two simple questions: Do you agree that global temperatures have generally risen since the pre-1800s? and Do you think that human activity is a significant contributing factor? They asked some other questions too, but didn’t report the questions or results in the publication. They didn’t single out greenhouse gases, they didn’t explain what the term “significant” meant, and they didn’t refer to danger or crisis.
So what was the result? Of the 3,146 responses they received, 90 percent said yes to the first question, that global temperatures had risen since the Little Ice Age, and only 82 percent said yes to the second, that human activity was a significant contributing factor. Interestingly, among meteorologists only 64 percent said yes to the second, meaning a third of the experts in the study of weather patterns who replied didn’t think humans play a significant role in global warming, let alone a dominant one. What got the most media attention was that among the 77 respondents who described themselves as climate experts, 75 said yes to the second question. 75 out of 77 is 97 percent.
OK, it didn’t get any media attention that they took 77 out of 3,146 responses. But that’s the key statistical trick. They found a 97 percent consensus among 2 percent of the survey respondents. And even so it was only that there’d been some warming since the 1800s, which virtually nobody denies, and that humans are partly responsible. These experts didn’t say it was dangerous or urgent, because they weren’t asked.
Furthermore:
Another survey appeared in 2013, by Australian researcher John Cook and his coauthors, in which they claimed to have examined about 12,000 scientific papers related to climate change, and found that 97 percent endorsed the consensus view that greenhouse gases were at least partly responsible for global warming. This study generated headlines around the world, and it was the one to which Obama’s tweet was referring. But here again, appearances were deceiving.
Two-thirds of the papers that Cook and his colleagues examined expressed no view at all on the consensus. Of the remaining 34 percent, the authors claimed that 33 percent endorsed the consensus. Divide 33 by 34 and you get 97 percent. But this result is essentially meaningless, because they set the bar so low. The survey authors didn’t ask if climate change was dangerous or “manmade.” They only asked if a given paper accepted that humans have some effect on the climate, which as already noted is uncontroversial….
So a far better question would be: How many of the studies claimed that humans have caused most of the observed global warming? And oddly, we do know. Because buried in the authors’ data was the answer: A mere 64 out of nearly 12,000 papers! That’s not 97 percent, it’s one half of one percent. It’s one in 200.
97 Percent of scientists believe in catastrophic human caused climate change? Of course not! But far too many believe this ridiculous statement that defies basic logic and observation. (Can you think of any highly-political issue where you could get even 65% agreement?) The 97% Myth has succeeded in fooling many people because the phony number is repeated over and over again by those who have a financial and/or ideological stake in the outcome. By the way, what any scientist “believes’ doesn’t matter anyway. Science is what happens during rigorous and repeated experimentation.
**Regrettably, a graphic error appears on this video from 1:31 to 1:42. The percentage of climate studies that explicitly claim most of the recent warming is manmade was listed as “.03%” when it should have been “.3%”. The narration says “less than one-percent”, which is accurate. While the graphic is incorrect, the point being made is still completely valid. The “97%” mantra is a wildly inaccurate myth being cynically used to scare an unwary public.
Dennis Prager had Michael Shellenberger on his show to discuss his new book entitled “Apocalypse Never: Why Environmental Alarmism Hurts Us All” (Amazon: ). In an article by Michael, you see him transitioning into a “Bjorn Lomborg” type of category. Here is the opening paragraph of that article:
On behalf of environmentalists everywhere, I would like to formally apologize for the climate scare we created over the last 30 years. Climate change is happening. It’s just not the end of the world. It’s not even our most serious environmental problem. (ENVIRONMENTAL PROGRESS)
Facts through reason and common sense have made it through to this gentleman, and this is nice to hear. In another review of the book, it is noted that Mr. Shellenberger is a long time environmentalist and contributed “rationalism [that] is in woefully short supply in present day environmental discourse. Michael Shellenberger’s Apocalypse Never succeeds in providing a welcome boost” Here is the opening of that review:
The way to a cleaner, sustainable planet is not to eliminate fossil fuels and nuclear power, but rather to expand their use, especially in developing countries to bring economic growth and prosperity, the way such sources did for the developed world.
This is one of the primary themes in the new book, Apocalypse Never, written not by a “climate denier” or “corporate shill.” Instead, author Michael Shellenberger is a 30-year environmental activist with street cred in various causes including saving California’s redwood forests and co-founding a “progressive Democratic, labor-environment push” in 2002 for the New Apollo Project, a renewable energy initiative that long predated the Green New Deal. He also is a Time magazine “Hero of the Environment.”…..
…Unfortunately, despite Attenborough’s despicable attempts to yank on heartstrings, the population of dangerous polar bears is not falling.
The actual victims here are children young enough to take this crap seriously; ecoanxiety can be a serious psychiatric disorder, as Greta Thunberg demonstrates.
Hoo Boy… now Netflix and other Media and environmental orgs are saying Walruses are a proof of Global Warming… except… this phenomenon has been observed for a long, long time. And IS NOT NEW like shown in popular media:
…Hype from the *Netflix/Attenborough ‘climate change is gonna destroy the world’ fearmongers earlier this year notwithstanding – or the media this summer trying to stir up climate change fever – the US Fish and Wildlife Service determined in October 2017 that the Pacific walrus is not being harmed by climate change and is not likely to be harmed within the foreseeable future (USFWS 2017). The IUCN Red List (2015) lists the Pacific walrus as ‘data deficient‘.
Large herds onshore are a sign of population health, not climate change, and walruses have come ashore in the Chukchi Sea during the ice-free season in summer and/or fall for more than 100 years (Crockford 2014; Fischbach et al. 2016; Lowrey 1985). Those are the relevant scientific facts….
Dr Susan Crockford explains why the media coverage and statements by scientists and environmental organisations mislead people about the massive walrus haulout seen in Sept/October 2014. Read Susan Crockford’s paper, which refutes claims that Arctic walruses are in distress and danger due to global warming at: On The Beach: Walrus Haulouts Are Nothing New (PDF)
I had an opportunity last night to watch the original Netflix ‘Frozen Worlds’ walrus episode and have some addition thoughts.
One big eye-opener was the final shot of the walrus sequence: a polar bear approaching from the water to feed on the carcasses below the cliff at Cape Kozhevnikov. This is additional proof that polar bears were in the area while the crew were filming. Yet the narrative in the film was silent on the risk to walruses on the cliff from polar bears and not a word was spoken of the hundreds of walruses that had fallen off that very cliff just days before after being spooked by approaching bears.
Oddly, I have also discovered that the Russian scientific advisor to the film, Anatoli Kochnev, wrote a scientific report in 2002 (translated into English) on walrus deaths at two regularly used beach haulouts on Wrangel Island from 1989-1996, when walrus population numbers were much lower than today and summer sea ice extent was higher (Kochnev 2002). He concluded that stampedes initiated by polar bears were responsible for most of the walruses found trampled to death.
This means Kochnev knew that polar bears nearby were a huge risk factor for walrus stampedes over the cliff but went along with the official ‘Our Planet’ narrative that no polar bears were involved and only lack of sea ice and poor eyesight were to blame for the carnage presented in the Netflix film.
In addition, a Google-translated photo-essay published by Kochnev’s friend Yevgeny Basov who had been invited to witness the spectacle at Cape Kozhevnikov in the fall of 2017 (posted 11 November 2017, original link here)(h/t WUWT commenter “it doesn’t add up”). The metadata on the photos in this essay shows that Kochnev was there on 16 Septmber 2017 (photo #2) and that walruses were already dying from falls off the cliff on 17 September (photo #22, see below), two days beforethe ‘Our Planet’ footage was shot.
This is almost certainly the event reported in The Siberian Times, when 20 polar bears were said to have spooked walruses at the top of the cliff, with hundreds fell to their deaths on the rocks below…..
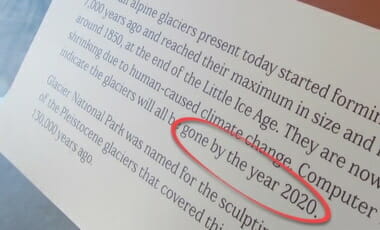
One can see pictures with dates on them, that the glaciers are not shrinking as predicted, in which Roger Roots documents some of the most famous spots the adorn most walls from Glacier National Park (WUWT):
…The average date of first freeze in East Glacier, Montana is September 13th. It is only then that one can assess whether the glaciers are getting bigger or smaller than in previous years.
In September 2015, Lysander Spooner University launched an annual research project aimed at visiting GNP’s glaciers every year at their lowest points. This year a small group of us opted to hike to the popular Grinnell Glacier and take a few snapshots on September 16. We hiked the 5.5 miles from the Many Glacier Hotel and arrived at glacier’s edge late in the afternoon.
The Grinnell is perhaps the most iconic of two dozen named glaciers in the Park. Untold thousands of people have hiked to it. Millions more have been exposed to government imagery of the Glacier melting away. The nearby Many Glacier Hotel features pictures on its walls showing the Grinnell’s decline from the 1880s to 2008. Numerous blog posts and magazine feature stories have also addressed this theme.
Upon our return to the Hotel after visiting the Glacier, we noticed that our brand-new photos appear to show that the Grinnell Glacier has grown slightly from the 2008 images that are displayed on the Hotel walls. There has been no reporting of this in any newspaper or broadcast that we know of. (In fact, all news coverage reports the precise opposite.) The smaller Gem Glacier—which is visible from the valley miles below—also appears to be slightly larger than it is shown in 2008 pictures on display….
….
ZEROHEDGEnote from WUWT’s article, the following, with an addition:
….The ‘gone by 2020’ claims were repeated in the New York Times, National Geographic, and other international news sources. But no mainstream news outlet has done any meaningful reporting regarding the apparent stabilization and recovery of the glaciers in GNP over the past decade. Even local Montana news sources such as The Missoulian, Billings Gazette and Bozeman Daily Chronicle have remained utterly silent regarding this story.
(Note that since September 2015 the author has offered to bet anyone $5,000 that GNP’s glaciers will still exist in 2030, in contradiction to the reported scientific consensus. To this day no one has taken me up on my offer. –R.R.)
I live very close to Glacier National Park, and while the media has been saying for years that the glaciers are “disappearing”, there has been no significant change in the park’s glaciers in the time I have resided here. The news above only reinforces the reality that if the climate is “changing”, it is only getting colder, NOT warmer…. – Brandon Smith, Founder of Alt-Market.com
But again, this is nothing new… glaciers have been shrinking (thank gawd) for 20,000 years. And the Scare tactics are nothing new (click pic for link):
“Since the 1950s, polar bear numbers have increased by around 400%” – Click here.
“water vapour is in fact the most abundant greenhouse gas” – Click here.
“CO2 only makes up 0.04%of the earth’s atmosphere” – Click here.
“multiple times in the earth’s history where CO2 levels have been higher and temperatures have been lower.” Click here, for Berner, et al. ‘Geocarb III’, a well known geochemical model of ancient CO2 levels showing them to be at vastly higher levels than currently. And here for Finnegan et al. ‘The Magnitude and Duration of Late Ordovician–Early Silurian Glaciation’ which examines the extent of glaciation during the Late Ordovician period, indicating much lower temperatures than currently.
“I was told 97% of scientists agree that human induced climate change is happening and that the ‘science is settled’.” Click here.
“500 scientists submitted a letter to the United Nations stressing there is no climate emergency, global warming has not increased natural disasters and the measures to fight climate change deny humans the life-giving benefits of electricity.” Read it here.
“Ivar Giaver thinks climate change is a pseudoscience.” Click here.
“Al Gore said that humanity had only 10 years left before the world would reach the point of no return.” Click here.
“In the 1970s there was scientific consensus that the earth was heading into a period of significant cooling or a possible ice age.” Click here.
“In 2009 Prince Charles said we had 8 years to save the world from ‘irretrievable climate and ecosystem collapse’.” Click here.
“Since 1990, 1.2 billion people have overcome extreme poverty.” Click here.
“137,000 people have been listen out of poverty everyday, for 25 years.” Click here.
“So rather than worrying about the world ending in … 11 years” Click here.
Recently, in 2014, the United Nations declared a climate “tipping point” by which the world must act to avoid dangerous global warming. “The world now has a rough deadline for action on climate change. Nations need to take aggressive action in the next 15 years to cut carbon emissions, in order to forestall the worst effects of global warming, says the Intergovernmental Panel on Climate Change,” reported the Boston Globe.
But way back in 1982, the UN had announced a two-decade tipping point for action on environmental issues. Mostafa Tolba, executive director of the UN Environment Program (UNEP), warned on May 11, 1982, that the “world faces an ecological disaster as final as nuclear war within a couple of decades unless governments act now.” According to Tolba, lack of action would bring “by the turn of the century, an environmental catastrophe which will witness devastation as complete, as irreversible as any nuclear holocaust.”
In 1989, the UN was still trying to sell that “tipping point” to the public. According to a July 5, 1989, article in the San Jose Mercury News, Noel Brown, the then-director of the New York office of UNEP was warning of a “10-year window of opportunity to solve” global warming. According to the Herald, “A senior U.N. environmental official says entire nations could be wiped off the face of the Earth by rising sea levels if the global warming trend is not reversed by the year 2000. Coastal flooding and crop failures would create an exodus of ‘eco-refugees,’ threatening political chaos.”
But in 2007, seven years after that supposed tipping point had come and gone, Rajendra Pachauri, then the chief of the UN IPPC, declared 2012 the climate deadline by which it was imperative to act: “If there’s no action before 2012, that’s too late. What we do in the next two to three years will determine our future. This is the defining moment.”
UN Secretary-General Ban Ki-moon announced his own deadline in August 2009, when he warned of “incalculable” suffering without a UN climate deal in December 2009. And in 2012, the UN gave Planet Earth another four-year reprieve. UN Foundation president and former U.S. Senator Tim Wirth called Obama’s re-election the “last window of opportunity” to get it right on climate change.
Heir to the British throne Prince Charles originally announced in March 2009 that we had “less than 100 months to alter our behavior before we risk catastrophic climate change.” As he said during a speech in Brazil, “We may yet be able to prevail and thereby to avoid bequeathing a poisoned chalice to our children and grandchildren. But we only have 100 months to act.”
To his credit, Charles stuck to this rigid timetable—at least initially. Four months later, in July 2009, he declared a ninety-six-month tipping point. At that time the media dutifully reported that “the heir to the throne told an audience of industrialists and environmentalists at St James’s Palace last night that he had calculated that we have just 96 months left to save the world. And in a searing indictment on capitalist society, Charles said we can no longer afford consumerism and that the ‘age of convenience’ was over.”
At the UN climate summit in Copenhagen in 2009, Charles was still keeping at it: “The grim reality is that our planet has reached a point of crisis and we have only seven years before we lose the levers of control.”
As the time expired, the Prince of Wales said in 2010, “Ladies and gentlemen we only—we now have only 86 months left before we reach the tipping point.”
By 2014, a clearly exhausted Prince Charles seemed to abandon the countdown, announcing, “We are running out of time. How many times have I found myself saying this over recent years?”
In the summer of 2017, Prince Charles’s one-hundred-month tipping point finally expired.26 What did Charles have to say? Was he giving up? Did he proclaim the end times for the planet? Far from it. Two years earlier, in 2015, Prince Charles abandoned his hundred-month countdown and gave the world a reprieve by extending his climate tipping point another thirty-five years, to the year 2050!
A July 2015 interview in the Western Morning News revealed that “His Royal Highness warns that we have just 35 years to save the planet from catastrophic climate change.” So instead of facing the expiration of his tipping point head on, the sixty-nine-year-old Charles kicked the climate doomsday deadline down the road until 2050 when he would be turning the ripe age of 102. (Given the Royal Family’s longevity, it is possible he may still be alive for his new extended deadline.)
Former Irish President Mary Robinson issued a twenty-year tipping point in 2015, claiming that global leaders have “at most two decades to save the world.”
Al Gore announced his own ten-year climate tipping point in 2006 and again in 2008, warning that “the leading experts predict that we have less than 10 years to make dramatic changes in our global warming pollution lest we lose our ability to ever recover from this environmental crisis.” In 2014, with “only two years left” before Gore’s original deadline, the climatologist Roy Spencer mocked the former vice president, saying “in the grand tradition of prophets of doom, Gore’s prognostication is not shaping up too well.”
Penn State Professor Michael Mann weighed in with a 2036 deadline. “There is an urgency to acting unlike anything we’ve seen before,” Mann explained. Media outlets reported Mann’s made a huge media splash with his prediction, noting “Global Warming Will Cross a Dangerous Threshold in 2036.”
Other global warming activists chose 2047 as their deadline, while twenty governments from around the globe chose 2030 as theirs, with Reuters reporting that millions would die by 2030 if world failed to act on climate: “More than 100 million people will die and global economic growth will be cut by 3.2% of GDP by 2030 if the world fails to tackle climate change, a report commissioned by 20 governments said on Wednesday. As global avg. temps rise due to ghg emissions, the effects on the planet, such as melting ice caps, extreme weather, drought and rising sea levels, will threaten populations and livelihoods, said the report conducted by the humanitarian organization DARA.”
As we saw in chapter five, top UK scientist Sir David King warned in 2004 that that by 2100 Antarctica could be the only habitable continent.
Tipping point rhetoric seems to have exploded beginning in 2002. An analysis by Reason magazine’s Ron Bailey found that tipping points in environmental rhetoric increased dramatically in that year…..
Prince EA’s mentioning that a future generation of people will not know what trees are is JUST LIKE people telling us kids will not know what snow is like:
Britain’s winter ends tomorrow with further indications of a striking environmental change: snow is starting to disappear from our lives.
Sledges, snowmen, snowballs and the excitement of waking to find that the stuff has settled outside are all a rapidly diminishing part of Britain’s culture, as warmer winters – which scientists are attributing to global climate change – produce not only fewer white Christmases, but fewer white Januaries and Februaries.
[….]
However, the warming is so far manifesting itself more in winters which are less cold than in much hotter summers. According to Dr David Viner, a senior research scientist at the climatic research unit (CRU) of the University of East Anglia,within a few years winter snowfall will become “a very rare and exciting event”.
“Children just aren’t going to know what snow is,” he said.
Funny thing is, some record breaking snow-fall followed in the years after… so much so that kids wished they forgot what it was.
But in all seriousness we are seeing similar dire predictions fail about the deforestation of trees. Keep in mind this is not a polemic proving all stories of deforestation false. I merely wish to bring some balance to the issue. For instance, in the Amazon, well over 95% of deforestation comes from cattle ranching, commercial agriculture, and infrastructure improvements. Less than 5% is from legal and illegal logging. Take note as well that The New York Times makes the point that,
“…for every acre of rain forest cut down each year, more than 50 acres of new forest are growing in the tropics on land that was once farmed, logged or ravaged by natural disaster.”
I love balance.
William Shatner, Captain Kirk of Star Trek fame, mentioned in a National Geographic video that, “rainforests [are] being cleared at the rate of 20 football fields per minute.” If this were truly the case, the forests would have been completely wiped out years ago. In Prince EA’s video he said 40 football fields! In an interview with Dr. Evaristo Eduardo de Miranda (one of the world’s leading experts on deforestation in the Amazon, is a professor of ecology at the University of Sao Paulo, Brazil’s largest institution of higher learning, and president of ECOFORCE, a private, nonprofit, environmental research/educational institution), he was asked where these numbers come from:
Q. There have been many reports by environmental groups in the U.S. claiming that the Amazon rain forest is being destroyed at a frightening pace. Many conflicting statistics are given concerning the alleged rate of destruction — 4 million hectares per year, 8 million hectares per year, 50,000 acres per day, etc. What are the facts and where are these statistics coming from?
A. A good example of this is the report released at the Earth Summit by the FAO [United Nations Food and Agriculture Organization]. FAO claims that the world tropical deforestation rate is 16.9 million hectares per year. FAO has up to the present been still using their discredited 8 million hectares per year rate for deforestation in Brazil. But when pressed at the summit they conceded to the 2.1 million hectares annually that the INPE, the Brazilian national space agency, has asserted is the real rate. This is an admission that they were inflating the deforestation rate by nearly 300 percent.
But they also said that deforestation for all of South America is 6.9 million hectares annually, which raises an obvious problem. Since Brazil has 70 percent of South America’s tropical forests, it would be incredible to suggest that other countries are deforesting at the levels necessary for the FAO figures to be valid. If you subtract the 2.1 million [Brazilian hectares] from the [FAO’s] 6.9 million, you have 4.8 million hectares being cut down annually in the 30 percent of South American tropical forests outside of Brazil. That is far greater than any data shows.
There is a similar problem with their annual 16.9 million hectares statistic for world deforestation. If you subtract Brazil’s 2.1 million, then you must ask who deforests the other 14.8 million hectares. When they were asked these questions, the FAO could not answer. They could not break the numbers down country by country or show any other means by which they arrived at this figure.
Q. No maps, no satellite photos, no national data ? Where did they conjure up these figures?
A. They were put in a very bad light because they could produce nothing to substantiate these fantastic figures. This is an important example, because if the FAO cannot sustain these numbers, then you can imagine that these eco-groups — the NGOs [Non-Governmental Organizations] — could not either. They always use these big numbers to make sensational news stories, but they never can break the aggregate numbers down to show where they come from, and they never produce maps with alleged areas of deforestation specified so that they can be independently verified.
One comment from the inter-webs noted: “The Amazon is just fine, as the people are moving out of the jungle to the cities and the jungle is raging back quite nicely. It’s in Indonesia and the area that the forests are being cut down for palm oil/biofuel productions.” Yep
In fact, the co-founder and long-time director of Greenpeace, Patrick Moore, said: “All these save-the-forests arguments are based on bad science…. They are quite simply wrong… [Phillip Stott and I] found that the Amazon rainforests is more than 90% intact. We flew over it and met all the environmental authorities. We studied satellite pictures of the entire area.” Phillip Stott, who has 30 years of studying tropical forests under his belt as well as being professor of biogeography at London University mentioned that, “there are now still – despite what humans have done – more rainforests today than there were 12,000 years ago.”
Conventional wisdom is often challenged as well by climatologists and specialists in their field. The NEW YORK TIMES passes along the complexity of an issue most people take for granted:
…Deforestation accounts for about 20 percent of global emissions of carbon dioxide. The assumption is that planting trees and avoiding further deforestation provides a convenient carbon capture and storage facility on the land.
That is the conventional wisdom. But the conventional wisdom is wrong.
[….]
Planting trees and avoiding deforestation do offer unambiguous benefits to biodiversity and many forms of life. But relying on forestry to slow or reverse global warming is another matter entirely.
The science says that spending precious dollars for climate change mitigation on forestry is high-risk: We don’t know that it would cool the planet, and we have good reason to fear it might have precisely the opposite effect. More funding for forestry might seem like a tempting easy win for the world leaders at the United Nations, but it’s a bad bet.
SCIENTIFIC AMERICAN gets a bit more detailed regarding the above. But this is a very complicated issue… especially since chopping down massive forests is being posited as a boon to fight “global warming” – to wit:
…A 2007 study in the Proceedings of the National Academy of Sciences found that global-scale deforestation would result in a net cooling, as the changes in albedo and evaporation would overwhelm the impact of all that carbon being released into the atmosphere. But that doesn’t mean we should go about chopping down every tree we can—on the whole, preserving tropical forests and even adding more trees in the equatorial latitudes will be beneficial for the climate, not to mention the biodiversity that depends on rainforests. But large-scale reforestation or afforestation projects in the north may not be the best idea, as Lee says:
People are debating whether afforestation is a good idea in high latitudes. If you plant trees you sequester carbon, which is a benefit to the climate system. At the same time, if you plant trees you warm the landscape because trees are darker compared to other vegetation types. So they absorb solar radiation.
The study is another reminder of just how devilishly complicated the climate system really is….
Like I said – challenging conventional wisdom. In reality, what throws many of these studies of deforestation off is the urban heat island effect and rural cold island effect. For more on this see Dr. S. Jeevananda Reddy’s (bio) book/chapter: “Climate Change: Myths & Realities”, 2008 — Chapter 7: Ecological changes.
NATIVE-AMERICANS
The second point I wish to comment on, and it is Prince EA’s mentioning of the Native-Americans. I do not doubt that Prince was taught these things in school. However, like many other issues cornered in the monopoly of the government, balance is needed.
For instance, I wrote a response to an in-class supplement to my sons elementary class lesson [he is now married and lives in Florida] about HOW the Settlers treated the New World versus how the Indians treated it. I made sure each parent got a copy and this engendered a visit to see the principle. Here is a quote from that post:
From James Fenimore Cooper to Dances with Wolves and Disney’s Pocahontas, American Indians have been mythologized as noble beings with a “spiritual, sacred attitude towards land and animals, not a practical utilitarian one.”[16] Small children are taught that the Plains Indians never wasted any part of the buffalo. They grow up certain that the Indians lived as one with nature, and that white European settlers were the rapists who destroyed it.
In The Ecological Indian: Myth and History, Shepard Krech III, an anthropologist at Brown University, strips away the myth to show that American Indians behaved pretty much like everyone else. When times were bad they used the whole buffalo. When times were good, “whole herds” of buffalo might be killed only for their tongues or their fetuses.[17] Although American Indians adapted to their environment and were intimately familiar with it, they had no qualms about shaping it to their needs.
Indians set fires to promote the growth of grasses and make land more productive for the game and plants that they preferred. Sometimes fire was used carefully. Sometimes it was not. Along with the evidence that Indians used fire to improve habitat are abundant descriptions of carelessly started fires that destroyed all plant life and entire buffalo herds.[18]
Nor were American Indians particularly interested in conserving resources for the future. In the East, they practiced slash and burn agriculture. When soils became infertile, wood for fuel was exhausted, and game depleted, whole villages moved.[19] The Cherokee, along with the other Indians who participated in the Southern deerskin trade, helped decimate white-tailed deer populations.[20] Cherokee mythology believed that deer that were killed in a hunt were reanimated.
In all, contemporary accounts suggest that many Indians treated game as an inexhaustible resource. Despite vague hints in the historical records that some Crees may have tried to conserve beaver populations by allocating hunting territories and sparing young animals, Krech concludes that it was “market forces in combination with the Hudchild’s Bay Company policies [which actively promoted conservation]” that “led to the eventual recovery of beaver populations.”[21]
Those who blame European settlers for genocide because they introduced microbes that ravaged native populations might as well call the Mongols genocidal for creating the plague reservoirs that led to the Black Death in Europe.[22] Microbes travel with their hosts. Trade, desired by Indians as well as whites, created the pathways for disease.
[16]Shepard Krech III, The Ecological Indian: Myth and History, W.W. Norton & Company; New York: NY (1999), p. 22.
[17] Ibid., p. 135.
[18] Ibid., p. 119.
[19] Ibid., p. 76.
[20] Ibid., p. 171.
[21] Ibid., p. 188.
[22] For a discussion of the effect of the Mongol invasions and their effect on European epidemiology see, William H. McNeill, Plagues and Peoples, Doubleday; New York, NY (1977).
These little historical facts changes the narrative just a tad, doesn’t it? Like when the Iroquois directed their most furious attacks against the Hurons during the Beaver Wars. One Jesuit missionary wrote, “it is the design of the Iroquois to capture all the Hurons, if it is possible; to put the chiefs and great part of the nation to death, and with the rest to form one nation and one country.” American Indians, alongside the Settlers, accelerated their hunting of the American Bison (Buffalo) that contributed to the near extinction of this plains beast. All in the name of the Mighty Buck! (READ MORE)
POLAR BEAR BREAK
(An UPDATED POSTon an old one can be found showing the bottom line is that the current population is at record highs.) While not dealt with well in Prince EA’s video, his presentation shows a computerized Polar Bear[s] walking in the background while intimating extinction or low numbers. Again, he probably learned about this in school, so you cannot really blame him fully. He is the product of indoctrination. However, this just isn’t the case. In fact, there are a record number of Polar Bears. Here Is The Bottom Line:
1)It confirms the global population size I published in May 2015 (20,129-32,558; average 26,344). See the graph below, now amended to reflect this point. If global numbers do decline over the next 35 years, it will be from a high point not previously acknowledged by the IUCN Polar Bear Specialist Group (PBSG).
2) The current population trend is listed as: ? Unknown. [NOT declining – if anyone claims it is, send them here: IUCN Red List U. maritimus]
(MS) WINNIPEG, Canada (Globe and Mail 4/2012) The number of bears along the western shore of Hudson Bay, believed to be among the most threatened bear subpopulations, stands at 1,013 and could be even higher, according to the results of an aerial survey released Wednesday by the Government of Nunavut. That’s 66 per cent higher than estimates by other researchers who forecasted the numbers would fall to as low as 610 because of warming temperatures that melt ice faster and ruin bears’ ability to hunt. The Hudson Bay region, which straddles Nunavut and Manitoba, is critical because it’s considered a bellwether for how polar bears are doing elsewhere in the Arctic.
[….]
But many Inuit communities said the researchers were wrong. They said the bear population was increasing and they cited reports from hunters who kept seeing more bears. Mr. Gissing said that encouraged the government to conduct the recent study, which involved 8,000 kilometres of aerial surveying last August along the coast and offshore islands.
Mr. Gissing said he hopes the results lead to more research and a better understanding of polar bears. He said the media in southern Canada has led people to believe polar bears are endangered. “They are not.” He added that there are about 25,000 polar bears across Canada’s Arctic. “That’s likely the highest [population level]there has ever been.”
[Editors note: perhaps to 27,000-32,000?]
Again, this throws a monkey wrench into the narrative, and makes the next proposition trues if the counter proposition can be true:
Look, it is simple:
Either polar bears are dying because of CO2 emissions via man ~ hence, we should stopproducing high levels of CO2;
or [following the train of thinking FROM Al Gore],
Polar bears are at their highest recorded population levels because of CO2 emissions via man, hence, we should produce high levels of CO2.
Want to move on quick over this section? Here is my response to a Starbucks patron (of which I count myself) when they bring up sea rise:
“I believe in sea rise? Hell, 10,000 years ago it was 350ft lower. That is how the American Indian populated the continent.”
Mic Drop!
This was interesting because he calls out a news network. Good for him! He is wrong, but I like his style. This section I will deal with sea level rise in general, and then deal with the Bangladesh portion of Prince EA’s claims. The general sea rise refutation of the school-house session can be seen here, but let us look at a graph:
I wanted to draw the people who believe this (rising oceans) attention to a very old photograph compared to a new one to compare La Jolla (California) sea levels from 1871 to Now (REAL CLIMATE SCIENCE):
Also, Photographs show no change in Sydney sea level over the last 130 years (REAL CLIMATE SCIENCE):
But what interested me was his mentioning Bangladesh specifically… wrapped up in a challenge to Fox News.
Woa Whoa! Throwin’ down the gauntlet. I am going to answer this from various sources, but as you will see, this is another fail on the eco-fascists side. Here is a conservative source first:
It’s hard to believe that it’s been more than a month since the latest example of intellectual collapse at the IPCC. Now added to the fraudulent claims about Amazon rain forests, African crop harvests, and Himalayan glaciers comes the exposure of a very large error in the UN body’s warnings about flooding in Bangladesh. Turns out that the scientists screeching about the cataclysmic effects of sea-level rises forgot to consider sedimentary deposits (via Yid with Lid):
Scientists in Bangladesh posed a fresh challenge to the UN’s top climate change panel Thursday, saying its doomsday forecasts for the country in the body’s landmark 2007 report were overblown.
The Intergovernmental Panel on Climate Change (IPCC), already under fire for errors in the 2007 report, had said a one-metre (three-foot) rise in sea levels would flood 17 percent of Bangladesh and create 20 million refugees by 2050.
The claim helped create a widespread consensus that the low-lying country was on the “front line” of climate change, but a new study argues the IPCC ignored the role sediment plays in countering sea level rises. …
But IPCC’s prediction did not take into account the one billion tonnes of sediment carried by Himalayan rivers into Bangladesh every year, which are crucial in countering rises in sea levels, the study funded by the Asian Development Bank said.
“Sediments have been shaping Bangladesh’s coast for thousands of years,” said Maminul Haque Sarker, director of the Dhaka-based Center for Environment and Geographic Information Services (CEGIS), who led research for the study.
Even if the sea level rises that far — a claim which is itself greeted with increasing skepticism — most of the coastline for Bangladesh won’t be affected.
Deltas are formed at the boundary of rivers and oceans. The rivers that build deltas flow to low and slowly sinking parts of the crust, where large volumes of sediment are being deposited. They will always be in balance with sea level but almost by definition increase in size, if rivers are allowed to follow their course. Deltas, by their very nature are building out and up. They also tend to flood frequently and seasonally, often with disastrous effects on the inhabitants. People living in deltas should learn to swim, have a boat and generally be aware of what can happen. Sea level rise is not an issue in large deltas; they have been proven to be able to keep up with any sea level rise. Flooding disasters are seasonally the result of excessive run-off, and occasionally due to unfortunate storm surges that result in breaks through natural barriers, but this has nothing to do with sea level rise. Bangladesh will be there, even if all the ice in the world has melted, with its people still fighting floods while farming the fertile floodplains.
Scientific American also takes a wholly different course and shows that current flooding is caused in big part to the Bangladeshi’s themselves:
Man-made flood protections, not climate change, are the main culprit in sea-level rise in southwest Bangladesh, according to new research conducted for the U.S. Navy’s Office of Naval Research.
The report from a team of scientists at Vanderbilt University is the first part in a wide-ranging, $7.5 million analysis of environmental stress and human migration scenarios in the low-lying South Asian nation.
Published this week in Nature Climate Change, the initial study finds that embankments constructed since the 1960s are primarily to blame for lower land elevations along the Ganges-Brahmaputra River Delta, with some areas experiencing more than twice the rate of the most worrisome sea-level rise projections from the United Nations’ Intergovernmental Panel on Climate Change.
OF COURSE the magazine then goes on to assert Climate Disruption is still a threat to Bangladesh (towing the line is tough!). But this problem is moot because they gain land from the delta and the flooding is mainly “man-made,” so are the solutions [technology].
CHINA vs SARAH PALIN
WOW, another challenge. Good for you Prince EA! But again, your understanding is wrong.
The Atlantic Monthly has a VERY interesting article I read a few years back. They note that in reality the pollution in China is at our 1980-levels.
Does China, in short, truly deserve its reputation as an environmental pariah?
Ramon Guardans, a biologist who studies air pollution and co-chairs a global monitoring plan on toxic chemicals for the United Nations Environment Program, is skeptical.
“The air concentrations of several pollutants in sites in China are certainly comparable to the levels observed in heavily industrialized areas in Europe and North America before the 1970’s,” he wrote by email. But pound for pound, person for person these pollutant emissions were, and generally still are, much greater than China’s.
“So in relation to the population density we see in China,” Guardans continues, “the U.S. and Europe did a much dirtier job industrializing.”
Beijing just happens to be, similar to Los Angeles, in a geographical bind. Bloomberg makes this point as well around the same time the Atlantic Monthly does:
Why is Beijing susceptible to these episodes? First, and uncontrollable by the authorities, are the peculiarities of Beijing’s geography. In particular, the capital is surrounded by mountain ranges that lead to the unfortunate phenomenon of an inversion layer—cold air settles on top of a warmer air mass, trapping the pollutants inside. This is the same problem that bedevils Los Angeles.
Beyond the misfortune of geography, though, lie a number of factors that have everything to do with China’s policies….
China is blessed and cursed with the world’s largest coal reserves, which means that the country sources some 80 percent of its electricity from burning coal—and much of that coal is of lower quality and highly polluting.
But as I have clearly shown… wind and solar energy is no cleaner. And the dream in peoples heads is truly just that, a dream… I mean when Google caves, you know the end-is-nigh.
“Even if one were to electrify all of transport, industry, heating and so on, so much renewable generation and balancing/storage equipment would be needed to power it that astronomical new requirements for steel, concrete, copper, glass, carbon fibre, neodymium, shipping and haulage etc etc would appear. All these things are made using mammoth amounts of energy: far from achieving massive energy savings, which most plans for a renewables future rely on implicitly, we would wind up needing far more energy, which would mean even more vast renewables farms – and even more materials and energy to make and maintain them and so on. The scale of the building would be like nothing ever attempted by the human race.”
I must say I’m personally surprised at the conclusion of this study. I genuinely thought that we were maybe a few solar innovations and battery technology breakthroughs away from truly viable solar power. But if this study is to be believed, solar and other renewables will never in the foreseeable future deliver meaningful amounts of energy.
And bio-fuels cause, literally, food riots and starvation in poor countries and raise the price of food which hurt the poorer people in the more well off nations: Ethanol is killing children around the world… Democrats! It takes 450lbs of Corn to fill one SUV tank… that is a years worth of food for multiple children, not to mention the rise of corn-based food for the poor worldwide.(SEE MORE)
ICE MELTING
Here is another fail on the part of the doomsayers who speak with a tongue very similar to the eschatology handed us at the most fiery southern Baptist church.
Prince EA is just relying on others work that have been either proven wrong or fraudulant in nature. Here for instance we see some predictions simlar to Prince’s:
“Peter Wadhams, who heads the Polar Ocean Physics Group at the University of Cambridge… believes that the Arctic is likely to become ice-free before 2020 and possibly as early as 2015,” (YALE ENVIRONMENT 360 REPORTED IN 2012). Yet government data shows that arctic sea ice has increased since then….
Here I will post information from a PREVIOUS POST about Polar Bear population levels, in which I point the following out:
Recent Population Increase Partly Due To Lots of Sea-Ice
Canada (CBC News via the Canadian Coast Guard, 3/2014) [ARCTIC Sea Ice] The Canadian Coast Guard is pleading with merchant ships to plan their voyages well in advance this year as the organization’s icebreaker fleet confronts some of the worst ice conditions on the Atlantic Ocean in decades.
“Plan your voyage and we’ll all get through this,” said Mike Voight, the Atlantic region’s director of programs. “We’ve got a pretty bad or challenging ice year.”
The Canadian Ice Service, an arm of Environment Canada, said there is 10 per cent more ice this year compared to the 30-year average.
“We probably haven’t seen a winter this bad as far as ice for the past 25 years,” said Voight, referring to both the amount and thickness of the ice….
The American Geophysical Union (AGU) Abstract (12/2014) [ARCTIC sea ice] Despite a well-documented ~40% decline in summer Arctic sea ice extent since the late 1970’s, it has been difficult to estimate trends in sea ice volume because thickness observations have been spatially incomplete and temporally sporadic. While numerical models suggest that the decline in extent has been accompanied by a reduction in volume, there is considerable disagreement over the rate at which this has occurred. We present the first complete assessment of trends in northern hemisphere sea ice thickness and volume using 4 years of measurements from CryoSat-2. Between autumn 2010 and spring 2013, there was a 14% and 5% reduction in autumn and spring Arctic sea ice volume, respectively, in keeping with the long-term decline in extent. However, since then there has been a marked 41% and 9% recovery in autumn and spring sea ice volume, respectively, more than offsetting losses of the previous three years. The recovery was driven by the retention of thick ice around north Greenland and Canada during summer 2013 which, in turn, was associated with a 6% drop in the number of days on which melting occurred – climatic conditions more typical of the early 1990’s. Such a sharp increase in volume after just one cool summer indicates that the Arctic sea ice pack may be more resilient than has been previously considered.
Talking About Weather (7/2014) [ANTARCTIC sea ice] Antarctic sea ice has hit its second all-time record maximum this week. The new record is 2.112 million square kilometers above normal. Until the weekend just past, the previous record had been 1.840 million square kilometers above normal, a mark hit on December 20, 2007, as I reported here, and also covered in my book.
Mark Serreze, director of the National Snow and Ice Data Center, responded to e-mail questions and also spoke by telephone about the new record sea ice growth in the Southern Hemisphere, indicating that, somewhat counter-intuitively, the sea ice growth was specifically due to global warming.
Let us compare this to Al Gore saying the northern ice-caps will be gone
NewsBusters makes the point another way, in that the “media” is derelict in their duty:
The same year that former Vice President Al Gore predicted that the Arctic sea ice could be completely gone, Arctic ice reached its highest level in two years, according to a report by theDanish Meteorological Institute.
According to that report, which was cited by the Daily Mail (UK) on Aug. 30, “[t]he Arctic ice cap has expanded for the second year in a row.” The U.S. National Snow and Ice Data Center (NSIDC)confirmed this trend, but didn’t go into as much detail as the Danish Meteorological Institute.
But an examination of ABC, CBS and NBC news programs since the Daily Mail story was published found that all three networks ignored news that Arctic sea ice was at a two-year high….
“The West Antarctic ice sheet sits on bedrock which is below sea level. It formed during the ice age but the sea level rose 12,000 years ago and has been chipping away at it ever since. What happens to ice which sits on rock which is below sea level? Hint: it has nothing to do with CO2.” This is a comment from Real Science’s FLASHBACK to 1932 and how the ICe-Sheets were melting then (to the right).
AND FINALLY….
ROCKETS
I hate to break it to Prince EA, but that rocket to find other worlds would have to be powered by (in part) fossil fuels to break earths gravitational force. Not to mention the massive amount of energy (fossil fuels again) And often times the left kills innovation in areas (like nuclear) for ideological reasons. Keeping us dependent on fossil fuels.
You see, all of the above “sounds good,” and grand. But as Thomas Sowell says, liberals — unlike conservatives — do not ask three simple questions:
compared to what?
at what cost?
what hard-evidence do you have?
FOR INSTANCE, as an example, Google came to the logical conclusion that such endeavors with alternative fuels is unattainable:
We came to the conclusion that even if Google and others had led the way toward a wholesale adoption of renewable energy, that switch would not have resulted in significant reductions of carbon dioxide emissions. Trying to combat climate change exclusively with today’s renewable energy technologies simply won’t work; we need a fundamentally different approach.
[….]
“Even if one were to electrify all of transport, industry, heating and so on, so much renewable generation and balancing/storage equipment would be needed to power it that astronomical new requirements for steel, concrete, copper, glass, carbon fibre, neodymium, shipping and haulage etc etc would appear. All these things are made using mammoth amounts of energy: far from achieving massive energy savings, which most plans for a renewables future rely on implicitly, we would wind up needing far more energy, which would mean even more vast renewables farms – and even more materials and energy to make and maintain them and so on. The scale of the building would be like nothing ever attempted by the human race.”