…On September 11, 1972, Cronkite cited scientists’ predictions that there was a “new ice age” coming. He called that prediction from British scientist Hubert Lamb “a bit of bad news.”
Cronkite continued. “That while the weather may be just a little colder in the immediate years to come, the full extent of the new ice age won’t be reached for 10,000 years. And if you can stand any more good news, even then it won’t be as bad as the last ice age 60,000 years ago. Then New York, Cincinnati, St. Louis, were under 5,000 feet of ice. Presumably no traffic moved and school was let out for the day. And that’s the way it is, Monday, September 11, 1972.”
Lamb, the scientist Cronkite cited, was no fringe scientist. He founded the Climatic Research Unit at the University of East Anglia in Great Britain. When he died, the CRU director called him “the greatest climatologist of his time,” according to the Global Warming Policy Foundation. He was also credited with establishing “climate change as a serious research subject.”
Unlike scientists often quoted by the media today, GWPF said that Lamb viewed the Earth’s climate as changing constantly and naturally. Unlike its founder, CRU now has a major role in spreading global warming alarmism. CBS said in 2009, CRU “wields outsize influence” in warming circles. The Climategate scandal centered around leaked documents and emails from that organization….
Scaring the public in order to get funding is a multi-billion dollar industry, as is the push by leftists to “conquer” once and for all (since the days of Marx) “capitalism.” M.I.T.’s Richard Lindzen notes:
Billions of dollars have been poured into studies supporting climate alarm, and trillions of dollars have been involved in overthrowing the energy economy. So it is unsurprising that great efforts have been made to ramp up hysteria, even as the case for climate alarm is disintegrating.
The following resignation letter was sent by Hal Lewis, professor emeritus of physics at the University of California, Santa Barbara, to the American Physical Society:
Sent: Friday, 08 October 2010 17:19 Hal Lewis From: Hal Lewis, University of California, Santa Barbara To: Curtis G. Callan, Jr., Princeton University, President of the American Physical Society 6 October 2010
Dear Curt:
When I first joined the American Physical Society sixty-seven years ago it was much smaller, much gentler, and as yet uncorrupted by the money flood (a threat against which Dwight Eisenhower warned a half-century ago).
Indeed, the choice of physics as a profession was then a guarantor of a life of poverty and abstinence—it was World War II that changed all that. The prospect of worldly gain drove few physicists. As recently as thirty-five years ago, when I chaired the first APS study of a contentious social/scientific issue, The Reactor Safety Study, though there were zealots aplenty on the outside there was no hint of inordinate pressure on us as physicists. We were therefore able to produce what I believe was and is an honest appraisal of the situation at that time. We were further enabled by the presence of an oversight committee consisting of Pief Panofsky, Vicki Weisskopf, and Hans Bethe, all towering physicists beyond reproach. I was proud of what we did in a charged atmosphere. In the end the oversight committee, in its report to the APS President, noted the complete independence in which we did the job, and predicted that the report would be attacked from both sides. What greater tribute could there be?
How different it is now. The giants no longer walk the earth, and the money flood has become the raison d’être of much physics research, the vital sustenance of much more, and it provides the support for untold numbers of professional jobs. For reasons that will soon become clear my former pride at being an APS Fellow all these years has been turned into shame, and I am forced, with no pleasure at all, to offer you my resignation from the Society….
Selected highlights from the above video via CLIMATE DEPOT:
Lindzen on VP Joe Biden saying ‘Denying climate change is like denying gravity.’
Lindzen: ‘He’s absolutely right. Climate has been changing for 4.5 billion years and on all time scales.
This is the problem. These guys think saying climate changes, saying it gets warmer or colder by a few tenths of a degree should be taken as evidence that the end of the world is coming. And it completely ignores the fact that until this hysteria, climate scientists used to refer to the warm periods in our history as optima.
Lindzen on CO2: ‘So here we are demonizing a chemical — a molecule essential to life – CO2– we are declaring doom based on things we used to like and somehow we are supposed to overturn our whole economy in order to deal with this purported disaster.’
Lindzen on EPA Chief: ‘Obviously I don’t think [the science] matters to [EPA Chief] McCarthy. She has a political aim. She has her marching orders and they are the orders regardless of what the underlying science is.’
Lindzen on what impact EPA regs will have on climate: ‘No matter what you believe about climate, none of them will have any impact on climate. They do make energy more expensive less available, less useful, they do hurt the poor, and they raise prices. It’s hard to see what the upside is excerpt for the people who get the subsidies. The whole thing is fairly absurd. There is so much money changing hands.’
Large Cover Picture Of The 1974 “Radio Times” Cover (HERE).
ADDITION
BREITBART notes another interesting “evolving” positions towards evidence:
The American Physical Society (APS) has signalled a dramatic turnabout in its position on “climate change” by appointing three notorious climate skeptics to its panel on public affairs (POPA).
They are:
Professor Richard Lindzen, formerly Alfred P Sloan Professor of Meteorology at Massachussetts Institute of Technology (MIT), a highly regarded physicist who once described climate change alarmism on The Larry King Show as “mainly just like little kids locking themselves in darkclosets to see how much they can scare each other and themselves.”
John Christy, Professor of Atmospheric Science at the University of Alabama in Huntsville, who has written: “I’m sure the majority (but not all) of my IPCC colleagues cringe when Isay this, but I see neither the developing catastrophe nor the smokinggun proving that human activity is to blame for most of the warming wesee.”
Judith Curry, Chair of the School of Earth and Atmospheric Sciences at Georgia Tech, a former Warmist (and still a self-described “luke warmer”) who has infuriated many of her more extremist colleagues by defending skeptics and by testifying to the US House Subcommittee on the Environment that the uncertainties in forecasting climate science are much greater than the alarmists will admit.
The reason it’s so significant is that it comes only three years after one of the APS’s most distinguished members – Professor Hal Lewis – resigned in disgust at its endorsement of what he called “the global warming scam.”…..
He-Man Official | The Ice Age Cometh | He-Man Full Episode
I sometimes ask myself, “Why is the New York Times allowed to exist?” And I don’t mean: “Why doesn’t the government ban the paper?” because that’s not how I roll. But why is it that this roiling cesspool of lies continues to be supported after decades of outright lies, propaganda and just plain bad reporting. This is the paper that gave us Walter Duranty, for crying out loud. This is the paper that constantly warns of the dire threat of weather, whether warming or cooling, as this great roundup from American Thinker shows. (Notice how many other “respectable” journalistic institutions get in on the act that also still exist.)
— ACE OF SPADES
That’s the gist of an amazing chronology of the last 120 years of scare-mongering on climate, assembled by butnowyouknow.net and reprinted by the estimable Anthony Watts in Wattsupwiththat, who updates it to the present.
1902 – “Disappearing Glaciers…deteriorating slowly, with a persistency that means their final annihilation…scientific fact…surely disappearing.” – Los Angeles Times
1923 – “Scientist says Arctic ice will wipe out Canada” – Professor Gregory of Yale University, American representative to the Pan-Pacific Science Congress, – Chicago Tribune
1923 – “The discoveries of changes in the sun’s heat and the southward advance of glaciers in recent years have given rise to conjectures of the possible advent of a new ice age” – Washington Post
1933 – “…wide-spread and persistent tendency toward warmer weather…Is our climate changing?” – Federal Weather Bureau “Monthly Weather Review.”
1938 – Global warming, caused by man heating the planet with carbon dioxide, “is likely to prove beneficial to mankind in several ways, besides the provision of heat and power.”– Quarterly Journal of the Royal Meteorological Society
1938 – “Experts puzzle over 20 year mercury rise…Chicago is in the front rank of thousands of cities thuout the world which have been affected by a mysterious trend toward warmer climate in the last two decades” – Chicago Tribune
1939 – “Gaffers who claim that winters were harder when they were boys are quite right… weather men have no doubt that the world at least for the time being is growing warmer” – Washington Post
1954 – “…winters are getting milder, summers drier. Glaciers are receding, deserts growing” – U.S. News and World Report
1954 – Climate – the Heat May Be Off – Fortune Magazine
1959 – “Arctic Findings in Particular Support Theory of Rising Global Temperatures” – New York Times
1969 – “…the Arctic pack ice is thinning and that the ocean at the North Pole may become an open sea within a decade or two” – New York Times, February 20th, 1969
1969 – “If I were a gambler, I would take even money that England will not exist in the year 2000″ — Paul Ehrlich (while he now predicts doom from global warming, this quote only gets honorable mention, as he was talking about his crazy fear of overpopulation)
1970 – “…get a good grip on your long johns, cold weather haters – the worst may be yet to come…there’s no relief in sight” – Washington Post
1974 – Global cooling for the past forty years – Time Magazine
1974 – “Climatological Cassandras are becoming increasingly apprehensive, for the weather aberrations they are studying may be the harbinger of another ice age” –Washington Post
1974 – “As for the present cooling trend a number of leading climatologists have concluded that it is very bad news indeed” – Fortune magazine, who won a Science Writing Award from the American Institute of Physics for its analysis of the danger
1974 – “…the facts of the present climate change are such that the most optimistic experts would assign near certainty to major crop failure…mass deaths by starvation, and probably anarchy and violence” – New York Times
Cassandras are becoming increasingly apprehensive, for the weather aberrations they are studying may be the harbinger of another ice age
1975 – Scientists Ponder Why World’s Climate is Changing; A Major Cooling Widely Considered to Be Inevitable – New York Times, May 21st, 1975
1975 – “The threat of a new ice age must now stand alongside nuclear war as a likely source of wholesale death and misery for mankind” Nigel Calder, editor, New Scientist magazine, in an article in International Wildlife Magazine
1976 – “Even U.S. farms may be hit by cooling trend” – U.S. News and World Report
1981 – Global Warming – “of an almost unprecedented magnitude” – New York Times
1988 – I would like to draw three main conclusions. Number one, the earth is warmer in 1988 than at any time in the history of instrumental measurements. Number two, the global warming is now large enough that we can ascribe with a high degree of confidence a cause and effect relationship to the greenhouse effect. And number three, our computer climate simulations indicate that thegreenhouse effect is already large enough to begin to effect the probability of extreme events such as summer heat waves. – Jim Hansen, June 1988 testimony before Congress, see His later quote andHis superior’s objection for context
1989 -“On the one hand, as scientists we are ethically bound to the scientific method, in effect promising to tell the truth, the whole truth, and nothing but – which means that we must include all doubts, the caveats, the ifs, ands and buts. On the other hand, we are not just scientists but human beings as well. And like most people we’d like to see the world a better place, which in this context translates into our working to reduce the risk of potentially disastrous climate change. To do that we need to get some broad based support, to capture the public’s imagination. That, of course, means getting loads of media coverage. So we have to offer up scary scenarios, make simplified, dramatic statements, and make little mention of any doubts we might have. This “double ethical bind” we frequently find ourselves in cannot be solved by any formula. Each of us has to decide what the right balance is between being effective and being honest. I hope that means being both.” – Stephen Schneider, lead author of the Intergovernmental Panel on Climate Change,Discover magazine, October 1989
1990 – “We’ve got to ride the global warming issue. Even if the theory of global warming is wrong, we will be doing the right thing – in terms of economic policy and environmental policy” – Senator Timothy Wirth
1993 – “Global climate change may alter temperature and rainfall patterns, many scientists fear, with uncertain consequences for agriculture.” – U.S. News and World Report
1998 – No matter if the science [of global warming] is all phony . . . climate change [provides] the greatest opportunity to bring about justice and equality in the world.” —Christine Stewart, Canadian Minister of the Environment, Calgary Herald, 1998
2001 – “Scientists no longer doubt that global warming is happening, and almost nobody questions the fact that humans are at least partly responsible.” – Time Magazine, Monday, Apr. 09, 2001
2003 – Emphasis on extreme scenarios may have been appropriate at one time, when the public and decision-makers were relatively unaware of the global warming issue, and energy sources such as “synfuels,” shale oil and tar sands were receiving strong consideration” – Jim Hansen, NASA Global Warming activist, Can we defuse The Global Warming Time Bomb?, 2003
2006 – “I believe it is appropriate to have an over-representation of factual presentations on how dangerous it is, as a predicate for opening up the audience to listen to what the solutions are, and how hopeful it is that we are going to solve this crisis.” — Al Gore, Grist magazine, May 2006
2006 – “It is not a debate over whether the earth has been warming over the past century. The earth is always warming or cooling, at least a few tenths of a degree…” —Richard S. Lindzen, the Alfred P. Sloan professor of meteorology at MIT
2006 – “What we have fundamentally forgotten is simple primary school science. Climate always changes. It is always…warming or cooling, it’s never stable. And if it were stable, it would actually be interesting scientifically because it would be the first time for four and a half billion years.” —Philip Stott, emeritus professor of bio-geography at the University of London
2006 – “Since 1895, the media has alternated between global cooling and warming scares during four separate and sometimes overlapping time periods. From 1895 until the 1930’s the media peddled a coming ice age. From the late 1920’s until the 1960’s they warned of global warming. From the 1950’s until the 1970’s they warned us again of a coming ice age. This makes modern global warming the fourth estate’s fourth attempt to promote opposing climate change fears during the last 100 years.” –Senator James Inhofe, Monday, September 25, 2006
2007– “I gave a talk recently (on fallacies of global warming) and three members of the Canadian government, the environmental cabinet, came up afterwards and said, ‘We agree with you, but it’s not worth our jobs to say anything.’ So what’s being created is a huge industry with billions of dollars of government money and people’s jobs dependent on it.” – Dr. Tim Ball, Coast-to-Coast, Feb 6, 2007
2008 – “Hansen was never muzzled even though he violated NASA’s official agency position on climate forecasting (i.e., we did not know enough to forecast climate change or mankind’s effect on it). Hansen thus embarrassed NASA by coming out with his claims of global warming in 1988 in his testimony before Congress” – Dr. John S. Theon, retired Chief of the Climate Processes Research Program atNASA, see above for Hansen quotes
Section updated by Anthony:
2009 – Climate change: melting ice will trigger wave of natural disasters. Scientists at a London conference next week will warn of earthquakes, avalanches and volcanic eruptions as the atmosphere heats up and geology is altered. Even Britain could face being struck by tsunamis – “Not only are the oceans and atmosphere conspiring against us, bringing baking temperatures, more powerful storms and floods, but the crust beneath our feet seems likely to join in too,” – Professor Bill McGuire, director of the Benfield Hazard Research Centre, at University College London, – The Guardian, Sep 2009.
2010 – What Global Warming Looks Like. It was more than 5°C (about 10°F) warmer than climatology in the eastern European region including Moscow. There was an area in eastern Asia that was similarly unusually hot. The eastern part of the United States was unusually warm, although not to the degree of the hot spots in Eurasia. James Hansen – NASA GISS, August 11, 2010.
2011 – Where Did Global Warming Go? “In Washington, ‘climate change’ has become a lightning rod, it’s a four-letter word,” said Andrew J. Hoffman, director of the University of Michigan’s Erb Institute for Sustainable Development. – New York Times, Oct 15, 2011.
2012 – Global warming close to becoming irreversible-scientists. “This is the critical decade. If we don’t get the curves turned around this decade we will cross those lines,” said Will Steffen, executive director of the Australian National University’s climate change institute, speaking at a conference in London. Reuters, Mar 26, 2012
2013 – Global-warming ‘proof’ is evaporating. The 2013 hurricane season just ended as one of the five quietest years since 1960. But don’t expect anyone who pointed to last year’s hurricanes as “proof” of the need to act against global warming to apologize; the warmists don’t work that way. New York Post, Dec 5, 2013
2014 – Climate change: It’s even worse than we thought. Five years ago, the last report of the Intergovernmental Panel on Climate Change painted a gloomy picture of our planet’s future. As climate scientists gather evidence for the next report, due in 2014, Michael Le Page gives seven reasons why things are looking even grimmer. –New Scientist (undated in 2014)
One can see pictures with dates on them, that the glaciers are not shrinking as predicted, in which Roger Roots documents some of the most famous spots the adorn most walls from Glacier National Park (WUWT):
…The average date of first freeze in East Glacier, Montana is September 13th. It is only then that one can assess whether the glaciers are getting bigger or smaller than in previous years.
In September 2015, Lysander Spooner University launched an annual research project aimed at visiting GNP’s glaciers every year at their lowest points. This year a small group of us opted to hike to the popular Grinnell Glacier and take a few snapshots on September 16. We hiked the 5.5 miles from the Many Glacier Hotel and arrived at glacier’s edge late in the afternoon.
The Grinnell is perhaps the most iconic of two dozen named glaciers in the Park. Untold thousands of people have hiked to it. Millions more have been exposed to government imagery of the Glacier melting away. The nearby Many Glacier Hotel features pictures on its walls showing the Grinnell’s decline from the 1880s to 2008. Numerous blog posts and magazine feature stories have also addressed this theme.
Upon our return to the Hotel after visiting the Glacier, we noticed that our brand-new photos appear to show that the Grinnell Glacier has grown slightly from the 2008 images that are displayed on the Hotel walls. There has been no reporting of this in any newspaper or broadcast that we know of. (In fact, all news coverage reports the precise opposite.) The smaller Gem Glacier—which is visible from the valley miles below—also appears to be slightly larger than it is shown in 2008 pictures on display….
….
ZEROHEDGEnote from WUWT’s article, the following, with an addition:
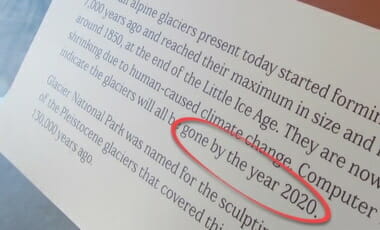
….The ‘gone by 2020’ claims were repeated in the New York Times, National Geographic, and other international news sources. But no mainstream news outlet has done any meaningful reporting regarding the apparent stabilization and recovery of the glaciers in GNP over the past decade. Even local Montana news sources such as The Missoulian, Billings Gazette and Bozeman Daily Chronicle have remained utterly silent regarding this story.
(Note that since September 2015 the author has offered to bet anyone $5,000 that GNP’s glaciers will still exist in 2030, in contradiction to the reported scientific consensus. To this day no one has taken me up on my offer. –R.R.)
I live very close to Glacier National Park, and while the media has been saying for years that the glaciers are “disappearing”, there has been no significant change in the park’s glaciers in the time I have resided here. The news above only reinforces the reality that if the climate is “changing”, it is only getting colder, NOT warmer…. – Brandon Smith, Founder of Alt-Market.com
But again, this is nothing new… glaciers have been shrinking (thank gawd) for 20,000 years. And the Scare tactics are nothing new (click pic for link):
For some reason the original uploads are in two parts, I combined them… the resolution is bad so I merely shrunk it as the main ideas are still sound:
(From the original video description) Anthony Watts is as interesting a person as you will meet in a lifetime. It was my pleasure to have him come to our KUSI News studio for an interview for my recent “Global Warming: Meltdown” program. Not only did I interview him, but most importantly, he presented his entire SURFACESTATIONS.ORG Powerpoint presentation as an answer to my second question. Anthony Watts is an American broadcast weather presenter (AMS sealholder retired), editor of the blog “Watts Up With That?”, owner of the weather graphics company It Works, and founder of the SurfaceStations.org project that documents the siting of weather stations across the United States. He is a meteorologist for KPAY-AM radio. (Part 1: https://youtu.be/ZzLNQV3dmcI | Part 2: https://youtu.be/x8vlFZlFWKw)
Here is a recent mention of the below in COMMENTARY MAGAZINE (added here 9-4-19, emphasis added here):
…A STUDYby meteorologist Anthony Watts found that almost 90 percent of the 1221 weather stations in the U.S. did not meet the National Weather Service’s setting standards, which requires that they be at least 100 feet from any artificial heat source or radiating surface. You can see some of the most egregious violators HERE. To deal with this defective information, climate scientists, have “adjusted” the data to solve this problem. Invariably, these adjustments have made earlier data show lower temperatures, and recent data show higher ones.
To develop reliable data, the National Oceanic and Atmospheric Administration (NOAA) placed 114 state-of-the-art weather stations relatively evenly spaced about the lower 48 states. They were carefully sited to be away from urban areas, which are heat islands, airports, which can be affected by jet exhaust, etc.
The system became operative in 2005. Now, realclearenergy.com is REPORTING that there has been no increase in average temperatures in the continental United States over the last 14 years, as measured by these new stations. If anything, overall temperatures are slightly cooler than they were….
Here are some examples of fudged data because of sub-standard equipment:
You’d think the answer would be obvious, but here we have a NOAA operated USHCN climate station of record providing a live experiment. It always helps to illustrate with photos. Today I surveyed a sewage treatment plant, one of 4 stations surveyed today (though I tried for 5) and found that for convenience, they had made a nice concrete walkway to allow servicing the Fisher-Porter rain gauge, which needs a paper punch tape replaced one a month.
Here is what you see in visible light:
Here is what the infrared camera sees:
Note that the concrete surface is around 22-24°C, while the grassy areas are between 12-19°C
Class 5 (error >~= 5C) – Temperature sensor located next to/above an artificial heating source, such a building, roof top, parking lot, or concrete surface.”
More than half of the stations the NOAA use are tainted or wrongly placed equipment.
This is meant mainly as a supplement to a Christmas Eve-Eve gathering/discussion I was at. I will make this post a little different than other posts, as, it will be “minimalist.” This is the second installment of the topics covered, which are polar bears, rising sea levels, CO2, Inconvenient Truth (the movie), nuclear power, warmest year, electric vehicles (EVs)/hybrid cars, and bullet trains.
Tarzan couldn’t take this kind of hot!
The question becomes this:
WHAT ARE THE DIFFERENT WAYS TO MEASURE TEMPERATURE,
WHICH ONE ARE MANY MEDIA SOURCES USING,
AND WHICH ARE THE MOST RELIABLE.
These are the questions any serious person who tells people 2014 is the hottest year as if they are the final arbiter of truth. I have dealt with this in the past, but will again deal with it here.
The two main research groups tracking global lower-tropospheric temperatures (our UAH group, and the Remote Sensing Systems [RSS] group) show 2014 lagging significantly behind 2010 and especially 1998:
Viewed another way:
Another instance highlighting the NOAA’s overestimating temperature is when it said October was the hottest month ever, but RSS data showed October to be ninth warmest on record. And I wonder what family members on the East-Coast would say to there being more than 400 record lows and record cool highs set, via The Weather Channel (11/2014):
A third surge of cold air pushed into the Northern Plains, Upper Midwest and East Coast. This third surge reinforced the cold temperatures for millions of Americans who have already endured at least a week of January-like chill.
There have been more than 400 record lows and record cool highs set, covering 43 states, since Sunday. That leaves only five states in the contiguous U.S., all in New England, that have not experienced record cold temperatures this week.
On Wednesday morning record lows were broken or tied from New York to Houston. Thursday morning brought more record cold to parts of the Southeast.
[….]
– First arctic surge: Spread into the East last week (November 11-15).
– Second arctic surge: Blasted through the East, Midwest, and South through early Thursday (November 16-20). For parts of the mid-Mississippi Valley, Ohio Valley, Tennessee Valley and the Middle Atlantic States, this was the coldest of the surges, with numerous daily record lows broken.
– Third arctic surge: Reached the Northern Plains and Upper Midwest Thursday, then slid east across the Great Lakes and parts of the Northeast on Friday. It did not press nearly as far south as the first and second surges did.
– Cold relief: Relief began in the Rockies, then expanded into the southern Plains and Southeast Wednesday and Thursday. Midwest and Northeast relief arrives this weekend.…
Okay, what we have already seen is that the satellite temperatures say 2014 will NOT BE the hottest year. One should ask what the hottest year was: 1934:
(L.A. Times) A slight adjustment to U.S. temperature records has bumped 1998 as the hottest year in the country’s history and made the Dust Bowl year of 1934 the new record holder, according to NASA.
[….]
That meant that 1998, which had been 0.02 degrees warmer than 1934, was now 0.04 degrees cooler.
This is where I transition to the NOAA temperature, but I wanted to take this transition with help from Dr. Willie Soon (NM), who is an Astrophysicist and Geoscientist at the Solar and Stellar Physics (SSP) Division, Harvard-Smithsonian Center for Astrophysics. (I will embolden the point made below.) More and more scientists have been coming out of the closet and Dr. Soon is one of them. He says in fact that if his community continues “to keep silent and do not express outrage like the one I now feel, the notion of science as a philosophy and way of life will soon be reduced to computer games and animation for the mind-controllers and beauty-contest institutions….” Dr. Soon continues:
2014 hottest year a manipulation
Is this a joke or simply my BAD dream? Prostituting science like this is now consider a virtue. It is no wonder that science writer Lord Ridley said that he has lost his faith on science as an institution.
Why would anyone even bother with claims and insistence of the globe in 2014 being the hottest to a relative colder years all within a few hundredths of a degree Celsius? Poor Anders Celsius should be dancing in his grave.
The claim is based on just one (from a half dozen or so) thermometer-based products whose measurement quality is fraught with uncertainty and with actual error bars at least ten times larger than those claimed “effects”.WMO and others simply pick and choose the “data” that produces the press news they want in time for the Lima, Peru political pow-wow.
In truth the datasets taken as a whole clearly show that the global temperature has been flat-trending for nearly two decades now and that the theory of rising CO2 leading to global warming is sorrowfully exaggerated.
This kind of manipulative science, exemplified by IPCC, WMO, NOAA and what have you, is serving its master in the realm of politics and policy, and is indeed very sickening.
All of them are essentially behaving in ways we would never want any of our school children to behave: cheating and manipulating that are accompanied by careful wording and clever rhetoric….
This sets us up for HOW the NOAA gets their temperatures, and why they are inaccurate. The below is posted elsewhere on my blog and is semi-technical for the layman. But the key is PLACEMENT, and you can see that in the photo’s below Dr. Mueller’s presentation on how the numbers are skewed/manipulated.
(Dr. Mueller is part of the Department of Physics at the University of California at Berkeley, and Faculty Senior Scientist at the Lawrence Berkeley Laboratory, where he is also associated with the Institute for Nuclear and Particle Astrophysics.)
ESPIONAGE
There seems to be a misunderstanding by the general public of the NOAA and other organizations and how they misuse data points (or average them wrongly).
So, for instance, professor Mueller at Berkeley mentions how climate “scientists” were hiding the decline in the past:
They were skewing the numbers in other words. This is an example of fraud. But numbers can be skewed by faulty or outdated methods/equipment. For instance,
EQUIPMENT FAIL
Here is a recent mention of the below in COMMENTARY MAGAZINE (added here 9-4-19):
…A STUDYby meteorologist Anthony Watts found that almost 90 percent of the 1221 weather stations in the U.S. did not meet the National Weather Service’s setting standards, which requires that they be at least 100 feet from any artificial heat source or radiating surface. You can see some of the most egregious violators here. To deal with this defective information, climate scientists, have “adjusted” the data to solve this problem. Invariably, these adjustments have made earlier data show lower temperatures, and recent data show higher ones.
To develop reliable data, the National Oceanic and Atmospheric Administration (NOAA) placed 114 state-of-the-art weather stations relatively evenly spaced about the lower 48 states. They were carefully sited to be away from urban areas, which are heat islands, airports, which can be affected by jet exhaust, etc.
The system became operative in 2005. Now, realclearenergy.com is reporting that there has been no increase in average temperatures in the continental United States over the last 14 years, as measured by these new stations. If anything, overall temperatures are slightly cooler than they were….
Here are some examples of fudged data because of sub-standard equipment:
You’d think the answer would be obvious, but here we have a NOAA operated USHCN climate station of record providing a live experiment. It always helps to illustrate with photos. Today I surveyed a sewage treatment plant, one of 4 stations surveyed today (though I tried for 5) and found that for convenience, they had made a nice concrete walkway to allow servicing the Fisher-Porter rain gauge, which needs a paper punch tape replaced one a month.
Here is what you see in visible light:
Here is what the infrared camera sees:
Note that the concrete surface is around 22-24°C, while the grassy areas are between 12-19°C
Class 5 (error >~= 5C) – Temperature sensor located next to/above an artificial heating source, such a building, roof top, parking lot, or concrete surface.”
More than half of the stations the NOAA use are tainted or wrongly placed equipment.
CHANGING DATA-SETS
Another example of changing averages was noted by Steve Goddard and others — even the NOAA have acknowledge it — have been discussing recently is exemplified in Dr. Judith Carry’s post on the matter (from a larger post of mine):
Even the Wall Street Journal chose the higher temperature reading to say that July of 2012 was July was the “hottest month in the contiguous U.S. since records began in 1895.” WUWT found this on accident and it has led to quite a few other revelations as we will see. Here is description in part of what we looking at:
Glaring inconsistencies found between State of the Climate (SOTC) reports sent to the press and public and the “official” climate database record for the United States. Using NCDC’s own data, July 2012 can no longer be claimed to be the “hottest month on record”.
[….]
I initially thought this was just some simple arithmetic error or reporting error, a one-off event, but then I began to find it in other months when I compared the output from the NCDC climate database plotter. Here is a table of the differences I found for the last two years between claims made in the SOTC report and the NCDC database output.
[….]
In almost every instance dating back to the inception of the CONUS Tavg value being reported in the SOTC report, there’s a difference. Some are quite significant. In most cases, the database value is cooler than the claim made in the SOTC report. Clearly, it is a systemic issue that spans over two years of reporting to the press and to the public.
It suggests that claims made by NCDC when they send out these SOTC reports aren’t credible because there are such differences between the data. Clearly, NCDC means for the plotter output they link to, to be an official representation to the public, so there cannot be a claim of me using some “not fit for purpose” method to get that data….
The WALL STREET JOURNAL made a graph showing this record setting month (below-left). The more accurate temperature for July likewise is shown in the same graph (below-right):
This looking at the data sets chosen and what is used and isn’t used to support an idea that fails in every way. Combine this obvious cherry-picking with the bias, collusion, and charges against the report that the President used to route Congress, all show we have a problem Houston! But this is only the tip of the proverbial iceberg. It seems the NOAA has been skewing these temps for some time. Why? Because the left uses this as a way to promote an ever growing government and the scientists get more-and-more funding. This data fudging story is newer, and it is evolving quickley, including this newest post via Real Science where Steve Goddard notes that More Than 40% Of USHCN Station Data Is Fabricated. Here is Dr. Judith carry’s synopsis (excerpted), in which she critiques a bit Goddard’s post… but then bows to the evidence:
OK, acknowledging that Goddard made some analysis errors, I am still left with some uneasiness about the actual data, and why it keeps changing. For example, Jennifer Marohasy has been writing about Corrupting Australian’s temperature record.
In the midst of preparing this blog post, I received an email from Anthony Watts, suggesting that I hold off on my post since there is some breaking news. Watts pointed me to a post by Paul Homewood entitled Massive Temperature Adjustments At Luling, Texas. Excerpt:
So, I thought it might be worth looking in more detail at a few stations, to see what is going on. In Steve’s post, mentioned above, he links to the USHCN Final dataset for monthly temperatures, making the point that approx 40% of these monthly readings are “estimated”, as there is no raw data.
From this dataset, I picked the one at the top of the list, (which appears to be totally random), Station number 415429, which is Luling, Texas.
Taking last year as an example, we can see that ten of the twelve months are tagged as “E”, i.e estimated. It is understandable that a station might be a month, or even two, late in reporting, but it is not conceivable that readings from last year are late. (The other two months, Jan/Feb are marked “a”, indicating missing days).
But, the mystery thickens. Each state produces a monthly and annual State Climatological Report, which among other things includes a list of monthly mean temperatures by station. If we look at the 2013 annual report for Texas, we can see these monthly temperatures for Luling.
Where an “M” appears after the temperature, this indicates some days are missing, i.e Jan, Feb, Oct and Nov. (Detailed daily data shows just one missing day’s minimum temperature for each of these months).
Yet, according to the USHCN dataset, all ten months from March to December are “Estimated”. Why, when there is full data available?
But it gets worse. The table below compares the actual station data with what USHCN describe as “the bias-adjusted temperature”. The results are shocking.
In other words, the adjustments have added an astonishing 1.35C to the annual temperature for 2013. Note also that I have included the same figures for 1934, which show that the adjustment has reduced temperatures that year by 0.91C. So, the net effect of the adjustments between 1934 and 2013 has been to add 2.26C of warming.
Note as well, that the largest adjustments are for the estimated months of March – December. This is something that Steve Goddard has been emphasising.
It is plain that these adjustments made are not justifiable in any way. It is also clear that the number of “Estimated” measurements made are not justified either, as the real data is there, present and correct.
Watts appears in the comments, stating that he has contacted John Nielsen-Gammon (Texas State Climatologist) about this issue. Nick Stokes also appears in the comments, and one commenter finds a similar problem for another Texas station.
Homewood’s post sheds light on Goddard’s original claim regarding the data drop out (not just stations that are no longer reporting, but reporting stations that are ‘estimated’). I infer from this that there seems to be a real problem with the USHCN data set, or at least with some of the stations. Maybe it is a tempest in a teacup, but it looks like something that requires NOAA’s attention. As far as I can tell, NOAA has not responded to Goddard’s allegations. Now, with Homewood’s explanation/clarification, NOAA really needs to respond….
So we see in the above, that temperatures can be changed years later as the totality of the data is included. What was considered the hottest falls to just an average month in the heat index.
And this has — within the past few months — turned into a very large debate.
EQUIPMENT FAIL II
Here is another example of older/faulty equipment:
A Quick Note about the Difference between RSS and UAH TLT data
There is a noticeable difference between the RSS and UAH lower troposphere temperature anomaly data. Dr. Roy Spencer discussed this in his July 2011 blog post On the Divergence Between the UAH and RSS Global Temperature Records. In summary, John Christy and Roy Spencer believe the divergence is caused by the use of data from different satellites. UAH has used the NASA Aqua AMSU satellite in recent years, while as Dr. Spencer writes:
…RSS is still using the old NOAA-15 satellite which has a decaying orbit, to which they are then applying a diurnal cycle drift correction based upon a climate model, which does not quite match reality.
While the two lower troposphere temperature datasets are different in recent years, UAH believes their data are correct, and, likewise, RSS believes their TLT data are correct. Does the UAH data have a warming bias in recent years or does the RSS data have cooling bias? Until the two suppliers can account for and agree on the differences, both are available for presentation.
ROSE COLORED GLASSES
Another example of competing ideas is this example from two major UK papers, the first being from the Guardian:
This next one from the Daily Mail:
(DAILY MAIL) ….The most widely used measurements of Arctic ice extent are the daily satellite readings issued by the US National Snow and Ice Data Center, which is co-funded by Nasa. These reveal that – while the long-term trend still shows a decline – last Monday, August 25, the area of the Arctic Ocean with at least 15 per cent ice cover was 5.62 million square kilometres.
This was the highest level recorded on that date since 2006 (see graph, right), and represents an increase of 1.71 million square kilometres over the past two years – an impressive 43 per cent.
Other figures from the Danish Meteorological Institute suggest that the growth has been even more dramatic. Using a different measure, the area with at least 30 per cent ice cover, these reveal a 63 per cent rise – from 2.7 million to 4.4 million square kilometres.
[….]
Crucially, the ice is also thicker, and therefore more resilient to future melting. Professor Andrew Shepherd, of Leeds University, an expert in climate satellite monitoring, said yesterday: ‘It is clear from the measurements we have collected that the Arctic sea ice has experienced a significant recovery in thickness over the past year.
‘It seems that an unusually cool summer in 2013 allowed more ice to survive through to last winter. This means that the Arctic sea ice pack is thicker and stronger than usual, and this should be taken into account when making predictions of its future extent.’
Same data used, one says BEWARE, the END IS NEAR, the other says making gains, as the graph shows below:
(So are Polar Bears, BTW) And the Antarctic has made BIG GAINS. But if the left — yes, the left — says we should renter the little ice-age to be at a normal point of “climate disruption,” then they are living a pipe-dream. As the earth gets warmer life flourishes, as warmer periods in history have exemplified:
June was ranked one of the coldest months in a while. According to the NOAA, July 2014 ranked 29th coldest out of 120using the Maximum temperature. And so we enter the discussion about if the pause is real… which is now being acknowledged by almost all (except the IPCC).
PAUSE
Here is Dr. Judith Curry posting ion the subject before getting into two papers that talk about it from two points of view:
With 39 explanations and counting, and some climate scientists now arguing that it might last yet another decade, the IPCC has sidelined itself in irrelevance until it has something serious to say about the pause and has reflected on whether its alarmism is justified, given its reliance on computer models that predicted temperature rises that have not occurred. – Rupert Darwall
The statement by Rupert Darwall concisely states what is at stake with regards to the ‘pause.’ This seriously needs to be sorted out….
For a running — updated — list of these excuses mentioned above, see here.What HAS been clearly shown is that while some wish to make CO2 illegal, CO2 is in fact not driving the climate:
GROUP-THINK
What is being shown as of late is that more-and-more scientists are becoming concerned with the group-think in the climate-sciences. Again, Dr. Judith Curry was the biggest pro-AGW proponent, but has — like many others leaders in their respective field — changed or softened her/their positions on what the science is actually showing:
The implications of dogmatic groupthink and intimidation for the pursuit of sound science — and sound policy — are chilling. – Christopher Snowden
A collection of articles from the health science community on the fate of papers and scientists that challenge the consensus.
SUN & OCEAN
Gross Scientific Negligence – IPCC Ignored Huge Body Of Peer-Reviewed Literature Showing Sun’s Clear Impact – See more at: http://tinyurl.com/kw47zcf (NASA is changing on this as well)
NASA is saying the sun — thanks to the Goddard Institute studying this, is the driver of warming and cooling: http://tinyurl.com/m29yo99 (Via Hockey Shtick)
And yet another study is showing the sun as the major player… NOT greenhouse gases.
So what’s the bottom line? NOAA temps change over time. Many in this respective field are seeing group-think. Ideology is driving this group-think, not science.
Why should you be interested? Sea surface temperature records indicate El Niño and La Niña events are responsible for the warming of global sea surface temperature anomalies over the past 30 years, not man-made greenhouse gases. I’ve searched sea surface temperature records for more than 4 years and ocean heat content records for more than 3 years, and I can find no evidence of an anthropogenic greenhouse gas signal in either dataset. That is, the warming of the global oceans has been caused by naturally occurring, sunlight-fueled, coupled ocean-atmosphere processes, not anthropogenic greenhouse gases.
No matter what evidences one puts forward, until people remove their rose-colored glasses, they will continue to explain away the pause showing CO2 has nothing to do with global temperatures.