Minimum Wage and Jobs (Who Is The Loser?)

PRO TIP: I use a browser separate from my go to that I can erase all the history and cookies in order to open up articles from sites (like Forbes or American Spectator) that regulate how many free articles you can access before a “pay wall” is set up and they block you from access to more. You may need to do this if you follow the links below.

In a continuing discussion [of sorts], some more articles regarding the Davis Bacon Act (coming in a future post) and minimum wage issues have been linked/levied. I do not have time to respond to them all, but I will to some of the major articles. Here I will extend the discussion about employment… but the gist of our positions are as follows:

An article linked by Chris L. was an enjoyable read is from FORBES. While I believe parts of it are wrong, it was a good, digestible size. (And the reason he linked it had to do with a “living wage” 9point #1], but the article – even there – does not support Chris’s contention. Linking that article is actually a train wreck for Chris L., 🤓) HOWEVER, the portion about jobs is in full agreement with my position above. Here is my main point from the author’s seven that is still my main premise:

3) Myth: An increase in the minimum wage is bad for employers

Paying a higher wage to employees can also help employers cut costs in other ways, according to the Center on Budget and Policy Priorities. “Beyond simple supply and demand theory,” reads a comprehensive report on the economics of raising the minimum wage, “increasing the minimum wage may also spur businesses to operate more efficiently and employees to work harder.”

Yes, excellent, so, “more efficiently” is the same as saying “using less labour for the same output”. That is, they’ve just said that business will fire some people as a result of the higher wages. Or, as we keep saying, there will be unemployment as a result.

I believe Chris L. posted this article as a refutation of my position — and I clearly made the points that raising minimum wage leads to loss of jobs (almost always for the poorest among us).

CONTINUING with that article:

5) Myth: It will cost us jobs and raise unemployment

So far, there is no evidence that raising the minimum wage causes an increase in unemployment or job loss. In fact, in a Goldman Sachs analysis of the 13 states which have raised their minimum wage, found that “the states where the minimum wage went up had faster employment growth than the states where the minimum wage remained at its 2013 level.”

“No evidence” is a pretty strict test to have to meet. And that statement is entirely wrong:

We estimate the minimum wage’s effects on low-skilled workers’ employment and income trajectories. Our approach exploits two dimensions of the data we analyze. First, we compare workers in states that were bound by recent increases in the federal minimum wage to workers in states that were not. Second, we use 12 months of baseline data to divide low-skilled workers into a “target” group, whose baseline wage rates were directly affected, and a “within-state control” group with slightly higher baseline wage rates. Over three subsequent years, we find that binding minimum wage increases had significant, negative effects on the employment and income growth of targeted workers. Lost income reflects contributions from employment declines, increased probabilities of working without pay (i.e., an “internship” effect), and lost wage growth associated with reductions in experience accumulation. Methodologically, we show that our approach identifies targeted workers more precisely than the demographic and industrial proxies used regularly in the literature. Additionally, because we identify targeted workers on a population-wide basis, our approach is relatively well suited for extrapolating to estimates of the minimum wage’s effects on aggregate employment. Over the late 2000s, the average effective minimum wage rose by 30 percent across the United States. We estimate that these minimum wage increases reduced the national employment-to-population ratio by 0.7 percentage point.

And:

We review the burgeoning literature on the employment effects of minimum wages – in the United States and other countries – that was spurred by the new minimum wage research beginning in the early 1990s. Our review indicates that there is a wide range of existing estimates and, accordingly, a lack of consensus about the overall effects on low-wage employment of an increase in the minimum wage. However, the oft-stated assertion that recent research fails to support the traditional view that the minimum wage reduces the employment of low-wage workers is clearly incorrect. A sizable majority of the studies surveyed in this monograph give a relatively consistent (although not always statistically significant) indication of negative employment effects of minimum wages. In addition, among the papers we view as providing the most credible evidence, almost all point to negative employment effects, both for the United States as well as for many other countries. Two other important conclusions emerge from our review. First, we see very few – if any – studies that provide convincing evidence of positive employment effects of minimum wages, especially from those studies that focus on the broader groups (rather than a narrow industry) for which the competitive model predicts disemployment effects. Second, the studies that focus on the least-skilled groups provide relatively overwhelming evidence of stronger disemployment effects for these groups.

There may be evidence you’ve not seen, evidence you don’t know about, even evidence you’d prefer not to believe but the statement that there’s no evidence is simply flat out false.

The same author in another FORBES article refutes the idea that there is “no evidence” in the Card/Krugman study, in which the idea is found via Krugman:

  • There’s just no evidence that raising the minimum wage costs jobs, at least when the starting point is as low as it is in modern America. — Paul Krugman

Said author slams this position well! As have I in a past posts:

(More Below Referencing This “Study”)

A N D, here is a article on the same topic via the DAILY SIGNAL:

1. It would be a job-killer.

The Congressional Budget Office report estimated that a $15 minimum wage would lead to 1.3 million lost jobs by the year 2025, with job losses rising over time due to compounding negative impacts.

The exact number of job losses are highly uncertain, but the report says losses would most likely range between zero and 3.7 million, with a not-insignificant chance that losses could exceed 3.7 million.

A 2011 Heritage Foundation estimate was even bleaker. It estimated a $15 minimum wage would lead to 7 million lost jobs.

Some groups have tried to minimize this part of the picture, focusing instead on the 17 million workers who currently earn below $15 that would receive an income boost. But this simply means that for every 13 workers who would get a wage boost, one worker would lose their job entirely.

Considering that a lost job can mean a family loses its home, not to mention a host of other long-term consequences, that doesn’t seem like a trade-off worth making.

One position is right, the other wrong. It may be the fact that most economists actually care about the poor and are not in Cris L.’s world all evil, greedy, GOP’ers… or as he put it: …”you’re going to post a portion of a book by a conservative economist…”

But the issue is not one economist, although he [Thomas Sowell], it really deals with history as most economists sift through it. Here, for example, is an article from FORBES:

In a comprehensive, 182-page summary of the research on this subject from the last two decades, economists David Neumark (UC-Irvine) and William Wascher (Federal Reserve Board) determined that 85 percent of the best research points to a loss of jobs following a minimum wage increase.

As in any academic discipline, there are outliers. But even the outliers are problematic: For instance, the famous (or rather, infamous) New Jersey study that associated a higher minimum with increased employment was later refuted in the same academic journal that originally published it. More recently, the paper that the President relied on to make his case for a higher minimum was debunked in a study published by the National Bureau of Economic Research.

Of course, the goal of minimum wage policy is not to reduce employment, but rather poverty. Indeed, Stevenson says explicitly in her commentary that a higher minimum wage will achieve this end. But empirical evidence refutes her point. Twenty-eight states raised minimum wages in the four years prior to passage of the last federal minimum wage increase. Economists from Cornell and American Universities, writing in the Southern Economic Journal, found no associated reduction in poverty rates….

[As an aside, I have the 182-page summary {book} mentioned in the article… I tried to find it on my book shelves, but, I am afraid I moved it to a box and placed it on my stored books pallet.]

New York is a good model as well for recent examples:

Over the past four years, the minimum wage for New York City restaurants that employ more than 10 workers went from $10.50 an hour to $15. That’s a whopping 43% increase. Next year, every restaurant, big and small, will have to pay their workers at least $15 an hour.

A big victory for workers, right? That’s how it’s depicted by the “Fight for $15” crowd. And, yes, if you held a full-time minimum-wage job over those years, your gross income would have gone up by $9,360.

But those massive wage hikes come at a painful cost that backers refuse to acknowledge. They kill jobs. Just like they’re doing right now in New York City.

In just the last three months of last year, 4,000 workers lost jobs at full-service restaurants, Bureau of Labor Statistics data show

(IBD)

And in an article referenced in the above excerpt, we find this (via AEI):

An article in the New York Eater (“Restaurateurs Are Scrambling to Cut Service and Raise Prices After Minimum Wage Hike“) highlights some of the suffering New York City’s full-service restaurants are experiencing following the December 31, 2018 hike in the city’s minimum wage to $15 an hour, which is 15.4% higher than the $13 minimum wage a year earlier, and 36.4% higher than the $11 an hour two years ago. For example, Rosa Mexicana operates four restaurants in Manhattan and estimates the $15 mandated wage will increase their labor costs by $600,000 this year. Here’s a slice:

Now, across the city, restaurant owners and operators are reworking their budgets and operations to come up with those extra funds. Some restaurants, like Rosa Mexicano, are changing scheduling. Other restaurateurs are cutting hours and staffers, raising menu prices, and otherwise nixing costs wherever they can.

And though the new regulations are intended to benefit employees, some restaurateurs and staffers say that take home pay ends up being less due to fewer hours — or that employees face more work because there are fewer staffers per shift. The bottom line is, we have to reduce the number of hours we spend,” says Chris Westcott, Rosa Mexicano’s president and CEO. “And unfortunately that means that, in many cases, employees are earning less even though they’re making more.”

In a survey conducted by New York City Hospitality Alliance late last year, about 75% of the more than 300 respondents operating full-service restaurants reported they’ll reduce employee hours this year because of the new wage increases, while 47% said they’ll eliminate jobs in 2019.

Note also that the survey also reported that “76.50% of respondents report reducing employee hours and 36.30% eliminated jobs in 2018 in response to mandated wage increases.”

So, to quote a “conservative” economist, Thomas Sowell, these raising wages — artificially, separate from the market — have consequences:

A majority of professional economists surveyed in Britain, Germany, Canada, Switzerland, and the United States agreed that minimum wage laws increase unemployment among low-skilled workers. Economists in France and Austria did not. However, the majority among Canadian economists was 85 percent and among American economists was 90 percent. Dozens of studies of the effects of minimum wages in the United States and dozens more studies of the effects of minimum wages in various countries in Europe, Latin America, the Caribbean, Indonesia, Canada, Australia, and New Zealand were reviewed in 2006 by two economists at the National Bureau of Economic Research. They concluded that, despite the various approaches and methods used in these studies, this literature as a whole was one “largely solidifying the conventional view that minimum wages reduce employment among low-skilled workers.”

[….]

Another group disproportionately affected by minimum wage laws are members of unpopular racial or ethnic minority groups. Indeed, minimum wage laws were once advocated explicitly because of the likelihood that such laws would reduce or eliminate the competition of particular minorities, whether they were Japanese in Canada during the 1920s or blacks in the United States and South Africa during the same era. Such expressions of overt racial discrimination were both legal and socially accepted in all three countries at that time.

Again, it is necessary to note how price is a factor even in racial discrimination. That is, surplus labor resulting from minimum wage laws makes it cheaper to discriminate against minority workers than it would be in a free market, where there is no chronic excess supply of labor. Passing up qualified minority workers in a free market means having to hire more other workers to take the jobs they were denied, and that in turn usually means either having to raise the pay to attract the additional workers or lowering the job qualifications at the existing pay level— both of which amount to the same thing economically, higher labor costs for getting a given amount of work done.

The history of black workers in the United States illustrates the point. As already noted, from the late nineteenth-century on through the middle of the twentieth century, the labor force participation rate of American blacks was slightly higher than that of American whites. In other words, blacks were just as employable at the wages they received as whites were at their very different wages. The minimum wage law changed that. Before federal minimum wage laws were instituted in the 1930s, the black unemployment rate was slightly lower than the white unemployment rate in 1930. But then followed the Davis-Bacon Act of 1931, the National Industrial Recovery Act of 1933 and the Fair Labor Standards Act of 1938— all of which imposed government-mandated minimum wages, either on a particular sector or more broadly.

The National Labor Relations Act of 1935, which promoted unionization, also tended to price black workers out of jobs, in addition to union rules that kept blacks from jobs by barring them from union membership. The National Industrial Recovery Act raised wage rates in the Southern textile industry by 70 percent in just five months and its impact nationwide was estimated to have cost blacks half a million jobs. While this Act was later declared unconstitutional by the Supreme Court, the Fair Labor Standards Act of 1938 was upheld by the High Court and became the major force establishing a national minimum wage. As already noted, the inflation of the 1940s largely nullified the effect of the Fair Labor Standards Act, until it was amended in 1950 to raise minimum wages to a level that would have some actual effect on current wages. By 1954, black unemployment rates were double those of whites and have continued to be at that level or higher. Those particularly hard hit by the resulting unemployment have been black teenage males.

Even though 1949— the year before a series of minimum wage escalations began— was a recession year, black teenage male unemployment that year was lower than it was to be at any time during the later boom years of the 1960s. The wide gap between the unemployment rates of black and white teenagers dates from the escalation of the minimum wage and the spread of its coverage in the 1950s. The usual explanations of high unemployment among black teenagers— inexperience, less education, lack of skills, racism— cannot explain their rising unemployment, since all these things were worse during the earlier period when black teenage unemployment was much lower. Taking the more normal year of 1948 as a basis for comparison, black male teenage unemployment then was less than half of what it would be at any time during the decade of the 1960s and less than one-third of what it would be in the 1970s.

Unemployment among 16 and 17-year-old black males was no higher than among white males of the same age in 1948. It was only after a series of minimum wage escalations began that black male teenage unemployment not only skyrocketed but became more than double the unemployment rates among white male teenagers. In the early twenty-first century, the unemployment rate for black teenagers exceeded 30 percent. After the American economy turned down in the wake of the housing and financial crises, unemployment among black teenagers reached 40 percent.

  • Thomas Sowell, Basic Economics: A Common Sense Guide to the Economy, 4th Edition (New York, NY: Basic Books, 2011), 241; 249-251

And here is more info regarding job loss as the main reason most economists are against the minimum wage… that is because employment IS THEE most important thing to poorer people (while I quote more conservative sources… they themselves are quoting more middle of the road studies):

  • Nearly 90 percent of surveyed economists believed an acceptable federal minimum wage should be less than $15 an hour. When asked what level of wage floor they would support, roughly 40 percent endorsed the current federal hourly minimum wage of $7.25 or less. And 66 percent said the minimum wage should be no higher than $10 an hour (FOX). The survey’s key findings include (PDF of survey can be found at EMPLOYMENT POLICIES INSTITUTE):
    • 74 percent oppose raising the federal minimum wage to $15 an hour;
    • 84 percent believe a $15 minimum wage will have negative effects on youth employment;
    • Two-thirds of economists (66 percent) believe that an appropriate federal minimum wage is $10 an hour or less;
    • Just six percent believe a $15 minimum wage is a very efficient means to target individuals in poverty, while 64 percent said the same thing about the Earned Income Tax Credit (EITC).
  • The nonpartisan Congressional Budget Office said Monday that raising the federal minimum wage to $15 an hour, up from the current rate of $7.25 a hour, would likely cause 1.3 million people to lose their jobs. (WASHINGTON EXAMINER)
  • Economists aren’t certain about many things, but on the minimum wage, nearly all of them (90 percent, according to one survey) believe that the case is open and shut. All else being equal, if you raise the price of something (for instance, labor), then the demand for it (for instance, by employers) will decline. That’s not just a theory; it’s a law. (James Glassman, “Don’t Raise the Minimum Wage,” Washington Post [Feb 24, 1998]
  • …percentage of economists who agree…. A minimum wage increases unemployment among young and unskilled workers. (79%) (Robert M. Beren, Professor of Economics at Harvard University ~ [More: WINTERY KNIGHT])

These specialists are not promoting “a narrative,” but displaying historical consequences as common sense economic laws.


Another Real World Example


See another post where the “Billingsley” example is used: TAX THE RICH (Plus: CEO Pay vs. Worker Pay)

My statement still stands in response to keeping people off the government doll:

People Never PAID 90% in Taxes (Economic Myths)

This is posted for adding to a conversation from FACEBOOK where I repeatedly noted no one ever paid 90% in taxes after it was brought up by my antagonist — hoping the operative word “PAID” would sink in — (conversation reproduced at the end of this post for clarity — JUMP.) Other Posts that discuss related issues:

90% MYTH

(From the video):

  • “economic historian Phil Magness, of the American Institute for Economic Research, says that progressives miss an important fact: The high tax rates that America had in the past actually didn’t bring in much revenue. When rates were at 70 percent, Magness tells John Stossel, ‘A millionaire on average would pay 41 percent’.”

Even “CheckYourFact” says this:

  • While the top marginal income tax rate was over 90 percent [92%] while Eisenhower was president, few people were subject to that rate due to deductions and other tax loopholes. Top income earners paid much lower average tax rates.

(MISES.ORG has an excellent article dealing with the 90% issue, as well as GREY ENLIGHTENMENT)

ALMOST CLASSICAL notes this in their “The 90% Tax Rate Myth” post:

So, let’s get more complicated. When there was a 94% top rate in 1944-45, there were so many deductions and exclusions that the taxable income was not comparable to someone’s entire income. First, the top rate started at $200,000, which today is equal to $2,413,059.90 — so the maximum EMTR would apply only to incomes of $2.5 million. But, that’s still taxable income, not earned income.

In 1944, you could deduct business meals, all business travel, all forms of interest payments, and much more. You could even deduct spousal travel expenses on a business trip! (Why travel alone?) Companies could also “loan” or “provide” almost anything to an employee, from an apartment to standard benefits. It was possible to shelter tens of thousands of dollars from taxable income. Three-martini lunches and expense accounts were important realities, skewing tax calculations.

As a result of deductions and exclusions, even the theoretical maximum Real Rate of taxation at 60% in 1944 overstates taxation dramatically. The reality? On earned income, the richest U.S. taxpayers paid close to 40 percent of their earned incomes in taxes in 1944. We simply didn’t count much of the compensation as taxable income.

Allow me to introduce you to Hauser’s Law. Published in 1993 by William Kurt Hauser, a San Francisco investment economist, Hauser’s Law suggests, “No matter what the tax rates have been, in postwar America tax revenues have remained at about 19.5% of GDP.” This theory was published in The Wall Street Journal, March 25, 1993. For a variety of reasons, we seem to balance tax collections within a narrow range.

Since 1945, U.S. federal tax receipts have been fairly constant in terms of Gross Domestic Product (GDP), with taxes ranging from 15 to 20 percent of GDP. The graph is as follows:

When people demand higher taxes on the rich, usually phrased as paying a “fair share,” they are ignoring how our tax system has functioned historically. We could create more brackets, to tax the top 1% at a higher rate once again, but the net increase in tax revenues wouldn’t be dramatic. Why not? Because government spending is near historical highs: we are spending at near-WWII levels. It would be nearly impossible to tax enough to pay the federal bills, and doing so would likely crush the economy….

CREATING MORE REVENUE

So, what did JFK’s “the rising tide lifts all the boats,” Reagan’s tax cuts and Bush’s tax cuts show? (See: John F. Kennedy and Ronald Reagan Proved Tax Cuts Work“) That lower taxes brings in more revenue.

  • Should tax rates be higher? It’s the million dollar question! Up? Down? No change? Where in the world should taxes go? In election years, the question of tax rates fills the airwaves. In non-election years, the question of tax rates, again, fills the airwaves. So what’s the answer? UCLA Professor of Economics Tim Groseclose explains his research on the topic. Basically, there’s a certain point at which higher tax rates actually reduce the amount of revenue the government collects. What’s that point? When are tax rates too high? Learn a valuable lesson in economics, and public policy.

Which is why either a national sales tax or a flat tax would help fuel our GDP engine more. Thomas Sowell further explains via an excerpt (my scan from my book) of the “conclusion” of Thomas Sowell’s “The World of Numbers.” You can listen to the entirety of chapter 4 read via MIKE READS: Chpt 4(a) | Chpt 4(b).

I will also emphasize AEI’s PARTIAL QUOTE from my expanded quote — it has changed a bit due to my having the revised edition (as usual I add the references for people to further follow the rabbit trail):

THOMAS SOWELL

  • Thomas Sowell, Discrimination and Disparities: Revised and Enlarged Edition (New York, NY: Basic Books, 2019), 110-114; (references), 255-257.

IMPLICATIONS

The emphasis on complex statistical analysis in economics and other fields— however valuable, or even vital, such statistical analysis may be in many cases— can lead to overlooking simple but fundamental questions as to whether the numbers on which these complex analyses are based are in fact measuring what they seem to be measuring, or claim to be measuring. “Income” statistics which lump together annual salaries and multi-year capital gains are just one of many sets of statistics which could stand much closer scrutiny at this fundamental level— especially if laws and policies affecting millions of human beings are to be based on statistical conclusions.

What can be disconcerting, if not painful, are the simple and obvious fallacies that can pass muster in intellectual circles when these fallacies seem to advance the prevailing vision of what is called “social justice.” Among prominent current examples is French economist Thomas Piketty’s large international statistical study of income inequality, which was instantly acclaimed in many countries, despite such obvious and fundamental misstatements as one pointed out by Professor Steven Pinker of Harvard:

Thomas Piketty, whose 2014 bestseller Capital in the Twenty-First Century became a talisman in the uproar over inequality, wrote, “The poorer half of the population are as poor today as they were in the past, with barely 5 percent of total wealth in 2010, just as in 1910.” But total wealth today is vastly greater than it was in 1910, so if the poorer half own the same proportion, they are far richer, not “as poor.”66

In addition to speaking of percentages as if they represented a given amount of income or wealth over the course of a century, Professor Piketty also made such assertions as that, in income, “the upper decile is truly a world unto itself,”67 when in fact just over half of all Americans are in that upper decile at some point in their lives.68 When Piketty said that the top one percent sit atop the “hierarchy” and “structure of inequality,”69 he again verbally transformed a changing mix of people in particular income brackets into a fixed structure rather than a fluid process, in which most Americans do not remain in the same quintile from one decade to the next.

Such misstatements are different expressions of the same fundamental misconception. As an empirical study of the 400 richest Americans pointed out, Piketty “naively assumes that it’s the same people getting richer.”70 But the majority of the 400 richest Americans have earned their fortunes in their own lifetimes, rather than being heirs of the 400 largest fortunes of the past!71

Such misconceptions are not peculiar to Professor Piketty. Nor are these the only problems with his statistics. But that such simple and obvious misstatements can pass muster in intellectual circles is a problem and a danger that goes far beyond Thomas Piketty.

Whether income differences are measured before taxes or after taxes can change the degree of inequality. If inequalities are measured both after taxes and after government transfers, whether in money or in goods and services, that can reduce the inequality considerably, when high-income people pay higher taxes and low-income people receive most of the government transfers.

Statistics on tax rates themselves can be grossly misleading when changes in tax rates are described in such terms as “a $300 billion increase in taxes” or “a $300 billion decrease in taxes.In reality, all that the government can do is change the tax rate. How much tax revenue that will produce depends on how people react. There have been times when higher tax rates have produced lower tax revenues, and other times when lower tax rates have produced higher tax revenues,72 as well as times when tax rates and tax revenues moved in the same direction.

During the 1920s, for example, the tax rate on the highest income Americans was reduced from 73 percent to 24 percent— and the income tax revenue rose substantially73— especially income tax revenues received from people in the highest income brackets. Under the older and much higher tax rate, vast sums of money from wealthy investors were sheltered in tax-exempt securities, such as municipal bonds. The total amount of money invested in tax-free securities was estimated to be three times the size of the annual budget of the federal government, and more than half as large as the national debt.74

Such vast and legally untaxable sums of money caught the attention and aroused the ire of Secretary of the Treasury Andrew Mellon, who declared it “repugnant” in a democracy that there should be “a class in the community which cannot be reached for tax purposes.”75 Failing to get Congress to take steps toward ending tax exemptions for incomes from particular securities,76 Secretary Mellon sought instead to lower the tax rates to the point where it would in fact lead to collection of more tax revenues.

Tax-exempt securities tend not to pay as high a rate of return on investments as other securities, whose earnings are taxed. It made sense for wealthy investors to accept these lower rates of return from tax-exempt securities when the tax rate was 73 percent, but not after the tax rate was lowered to 24 percent. In terms of words on paper, the official tax rate on the highest incomes was cut from 73 percent to 24 percent in the 1920s. But, in terms of events in the real world, the tax rate actually paid— on staggering sums of money previously untouchable in tax shelters— rose from zero percent to 24 percent. This produced huge increases in tax revenues received from high-income people, both absolutely and as a percentage of all income taxes collected.77

This increase in income taxes collected from high-income taxpayers was a result of the plain fact that 24 percent of something is larger than 73 percent of nothing. Tax rate cuts in some later administrations also led to increases in tax revenues!78 For example, a front-page news story in the New York Times of July 9, 2006 said: “An unexpectedly steep rise in tax revenues from corporations and the wealthy is driving down the projected budget deficit this year.79

However unexpected this increase in tax revenues may have been to the New York Times and others decrying “tax cuts for the rich,” this was precisely the kind of outcome predicted and expected by others in various administrations over the years, who had urged that tax rates be cut, in order to get money disgorged from tax shelters and invested in the market economy. This included people in the Coolidge, Kennedy, Reagan and George W. Bush administrations, where there were similar outcomes.80 But the very possibility that tax rates and tax revenues can move in opposite directions is seldom mentioned in the media— a crucial error of omission.

These are not simply arguments about history. Among the consequences in our own time is that proposals to reduce income tax rates are automatically met with objections to reducing income tax revenues. In the Wall Street Journal of January 31, 2018, for example, economist Alan Blinder objected to tax rate cuts on grounds that “the deficit is already too large!”81

This is in defiance of what the New York Times reported about the unexpected reduction of the deficit by increased tax revenues during the administration of President George W. Bush. It is also in defiance of a record-breaking budget surplus after tax rates were reduced in the 1920s— a surplus large enough to allow about one-fourth of the national debt to be paid off.82 Like many others, Professor Blinder proceeded as if it were axiomatic that tax rate reductions mean tax revenue reductions.

There is, of course, no guarantee of what any given tax rate reduction will lead to in a given set of circumstances. But Professor Blinder’s assertion was not based on any argument that a tax rate reduction under particular current circumstances would lead to a reduction in tax revenues. There was in fact no argument whatever on that point, nor apparently any sense of need to make such an argument. Similarly, a twenty-first century book on President Calvin Coolidge likewise asserted that, as a result of the tax rate cuts during his administration, “the bounty that the rich enjoyed sapped the U.S. Treasury of funds it might have used for other ends.”83 Thus a record-breaking budget surplus under President Coolidge was verbally transmuted into a deprivation of funds, with the turn of a phrase.

All the voluminous and detailed statistics on tax rates and tax revenues published by the Internal Revenue Service, going back more than a hundred years, might as well not exist, as far as many of those with the prevailing social vision are concerned. This is ultimately not a question about history, but about what such heedlessness implies for the present and still more so for the future.

REFERENCES

66 Steven Pinker, Enlightenment Now: The Case for Reason, Science, Humanism, and Progress (New York: Viking, 2018), p. 99.

67 Thomas Piketty, Capital in the Twenty-First Century (Cambridge, Massachusetts: Harvard University Press, 2014), p. 252.

68 Thomas A. Hirschl and Mark R. Rank, “The Life Course Dynamics of Affluence,” PLoS ONE, January 28, 2015, p. 5.

69 Thomas Piketty, Capital in the Twenty-First Century, p. 278.

70 Robert Arnott, William Bernstein, and Lillian Wu, “The Myth of Dynastic Wealth: The Rich Get Poorer,” Cato Journal, Fall 2015, p. 461.

71 “Spare a Dime,” a special report on the rich, The Economist, April 4, 2009, p. 4.

72 See, for example, Phil Gramm and John F. Early, “The Myth of American Inequality,” Wall Street Journal, August 10, 2018, p. A15. See also Thomas Sowell, Basic Economics: A Common Sense Guide to the Economy, fifth edition (New York: Basic Books, 2015), pp. 426-427, 428.

73 Gene Smiley and Richard Keehn, “Federal Personal Income Tax Policy in the 1920s,” Journal ofEconomic History, Vol. 55, No. 2 (June 1995), p. 286; Benjamin G. Rader, “Federal Taxation in the 1920s,” The Historian, Vol. 33, No. 3 (May 1971), p. 432; Burton W. Fulsom, Jr., The Myth of the Robber Barons: A New Look at the Rise of Big Business in America, sixth edition (Herndon, Virginia: Young America’s Foundation, 2010), pp. 108, 115, 116.

74 Burton W. Fulsom, Jr., The Myth of the Robber Barons, sixth edition, p. 109.

75 Andrew W. Mellon, Taxation: The People’s Business (New York: The Macmillan Company, 1924), p. 170.

76 Gene Smiley and Richard Keehn, “Federal Personal Income Tax Policy in the 1920s,” Journal of Economic History, Vol. 55, No. 2 (June 1995), p. 289.

77 Burton W. Fulsom, Jr., The Myth of the Robber Barons, sixth edition, p. 116. The share of income tax revenues paid by people with incomes up to $50,000 a year fell, and the share of income tax revenues paid by people with incomes of $100,000 and up increased. At the extremes, taxpayers in the lowest income bracket paid 13 percent of all income tax revenues in 1921, but less than half of one percent of all income taxes in 1929, while taxpayers with incomes of a million dollars a year and up saw their share of income taxes paid rise from less than 5 percent to just over 19 percent. Gene Smiley and Richard Keehn, “Federal Personal Income Tax Policy in the 1920s,”Journal ofEconomic Histoy, Vol. 55, No. 2 (June 1995), p. 295; Benjamin G. Rader, “Federal Taxation in the 1920s,” The Historian, Vol. 33, No. 3 (May 1971), pp. 432-434.

78 Alan Reynolds, “Why 70% Tax Rates Won’t Work,” Wall Street Journal, June 16, 2011, p. A19; Stephen Moore, “Real Tax Cuts Have Curves,” Wall Street Journal, June 13, 2005, p. A13. Professor Joseph E. Stiglitz argued that the tax rate cuts during the Reagan administration failed: “In fact, Reagan had promised that the incentive effects of his tax cuts would be so powerful that tax revenues would increase. And yet, the only thing that increased was the deficit.” Joseph E. Stiglitz, The Price of Inequality (New York: W.W. Norton, 2012), p. 89. However, the tax revenues collected by the federal government during every year of the Reagan administration exceeded the tax revenues collected in any previous administration in the history of the country. Economic Report of the President: 2018 (Washington: Government Printing Office, 2018), p. 552; U. S. Bureau of the Census, Historical Statistics of the United States, Part 2, pp. 1104-1105. The deficit reflected the fact that there is no amount of money that Congress cannot outspend.

79 Edmund L. Andrews, “Surprising Jump in Tax Revenues Curbs U.S. Deficit,” New York Times, July 9, 2006, p. Al.

80 James Gwartney and Richard Stroup, “Tax Cuts: Who Shoulders the Burden?” Federal Reserve Bank of Atlanta Economic Review, March 1982, pp. 19-27; Benjamin G. Rader, “Federal Taxation in the 1920s: A Re-examination,” Historian, Vol. 33, No. 3, p. 432; Burton W. Folsom, Jr., The Myth of the Robber Barons, sixth edition, p. 116; Robert L. Bartley, The Seven Fat Years: And How to Do It Again (New York: The Free Press, 1992), pp. 71-74; Alan Reynolds, ‘Why 70% Tax Rates Won’t Work,” Wall Street Journal, June 16, 2011, p. A19; Stephen Moore, “Real Tax Cuts Have Curves,” Wall Street Journal, June 13, 2005, p. A13; Economic Report of the President: 2017 (Washington: Government Printing Office, 2017), p. 586. See also United States Internal Revenue Service, Statistics of Income 1920-1929 (Washington: Government Printing Office, 1922-1932).

81 Alan S. Blinder, “Why Now Is the Wrong Time to Increase the Deficit,” Wall Street Journal, January 31, 2018, p. A15.

82 The national debt, which was a little over $24 billion in 1920— the last year of President Woodrow Wilson’s administration— was reduced to less than $18 billion in 1928, the last year of President Calvin Coolidge’s administration. U. S. Bureau of the Census, _Historical Statistics ofthe United States, Part 2, p.1104. See also David Greenberg, Calvin Coolidge (New York: Times Books, 2006), p. 67.

83 David Greenberg, Calvin Coolidge, p. 72.


CONVERSATION


“Redlining” | Thomas Sowell

BANK LOANS

Group Disparities

In the course of a long and heated campaign in politics and in the media during the early twenty-first century, claiming that there was rampant discrimination against black home mortgage loan applicants, data from various sources were cited repeatedly, showing that black applicants for the most desirable kind of mortgage were turned down substantially more often than white applicants for those same mortgages.

In the year 2000, for example, data from the U.S. Commission on Civil Rights showed that 44.6 percent of black applicants were turned down for those mortgages, while only 22.3 percent of white applicants were turned down.1 These and similar statistics from other sources set off widespread denunciations of mortgage lenders, and demands that the government “do something” to stop rampant racial discrimination in mortgage lending institutions.

The very same report by the U.S. Commission on Civil Rights, which showed that blacks were turned down for conventional mortgages at twice the rate for whites, contained other statistics showing that whites were turned down for those same mortgages at a rate nearly twice that for “Asian Americans and Native Hawaiians.”

While the rejection rate for white applicants was 22.3 percent, the rejection rate for Asian Americans and Native Hawaiians was 12.4 percent.2 But such data seldom, if ever, saw the light of day in most newspapers or on most television news programs, for which the black-white difference was enough to convince journalists that racial bias was the reason.

That conclusion fit existing preconceptions, apparently eliminating a need to check whether it also fit the facts. This one crucial omission enabled the prevailing preconception to dominate discussions in politics, in the media and in much of academia.

One of the very few media outlets to even consider alternative explanations for the black-white statistical differences was the Atlanta Journal-Constitution, which showed that 52 percent of blacks had credit scores so low that they would qualify only for the less desirable subprime mortgages, as did 16 percent of whites. Accordingly, 49 percent of blacks in the data cited by the Atlanta Journal-Constitution ended up with subprime mortgages, as did 13 percent of whites and 10 percent of Asians.3 In short, the three groups’ respective rankings in terms of the kinds of mortgage loans they could get was similar to their respective rankings in average credit ratings.

But such statistics, so damaging to the prevailing preconception that intergroup differences in outcomes showed racial bias, were almost never mentioned in most of the mass media. With credit ratings being what they were, the statistics were consistent with Discrimination IA (judging each applicant as an individual), but were reported in the media, in politics and in academia as proof of Discrimination II, arbitrary bias against whole groups.

While the omitted statistics would have undermined the prevailing preconception that white lenders were biased against black applicants, that preconception at least seemed plausible, even if it failed to stand up under closer scrutiny. But the idea that white lenders would also be discriminating against white applicants, and in favor of Asian applicants, lacked even plausibility. What was equally implausible was that black-owned banks were discriminating against black applicants. But in fact black-owned banks turned down black applicants for home mortgage loans at a higher rate than did white-owned banks.4

[1] United States Commission on Civil Rights, Civil Rights and the Mortgage Crisis (Washington: U.S. Commission on Civil Rights, 2009), p. 53.

[2] Ibid. See also page 61; Robert B. Avery and Glenn B. Canner, “New Information Reported under HMDA and Its Application in Fair Lending Enforcement,” Federal Reserve Bulletin, Summer 2005, p. 379; Wilhelmina A. Leigh and Danielle Huff, “African Americans and Homeownership: The Subprime Lending Experience, 1995 to 2007,” Joint Center for Political and Economic Studies, November 2007, p. 5.

[3] Jim Wooten, “Answers to Credit Woes are Not in Black and White,” Atlanta Journal-Constitution, November 6,2007, p. 12A.

[4] Harold A. Black, M. Cary Collins and Ken B. Cyree, “Do Black-Owned Banks Discriminate Against Black Borrowers?” Journal of Financial Services Research, Vol. 11, Issue 1-2 (February 1997), pp. 189-204. Here, as elsewhere, it should not be assumed that two unexamined samples are equal in the relevant variable& In this case, there is no reason to assume that those blacks who applied to black banks were the same as those blacks who applied to white banks.

Thomas Sowell, Discrimination and Disparities, Revised and Enlarged Edition (New York, NY: Basic Books, 2019), 88-89 (added references).

With Michelle Obama recently railing on White Americans for “white flight” from her Chicago neighborhood as a kid, Larry explains his experience with the same phenomenon growing up in Los Angeles. However, he describes a very different experience with the issue of race relations, and it’s not as black and white as one would think.

BACKGROUND CHECKS

To take an extreme example of Discrimination 1b, for the sake of illustration, if 40 percent of the people in Group X are alcoholics and 1 percent of the people in Group Y are alcoholics, an employer may well prefer to hire only people from Group Y for work where an alcoholic would be not only ineffective but dangerous. This would mean that a majority of the people in Group X — 60 percent in this case — would be denied employment, even though they are not alcoholics.

What matters, crucially, to the employer is the cost of determining which individual is or is not an alcoholic, when job applicants all show up sober on the day when they are seeking employment.

This also matters to the customers who buy the employer’s products and to society as a whole. If alcoholics produce a higher proportion of products that turn out to be defective, that is a cost to customers, and that cost may take different forms. For example, the customer could buy the product and then discover that it is defective. Alternatively, defects in the product might be discovered at the factory and discarded. In this case, the customers will be charged higher prices for the products that are sold, since the costs of defective products that are discovered and discarded at the factory must be covered by the prices charged for the reliable products that pass the screening test and are sold.

To the extent that alcoholics are not only less competent but dangerous, the costs of those dangers are paid by either fellow employees who face those dangers on the job or by customers who buy dangerously defective products, or both. In short, there are serious costs inherent in the situation, so that either 60 percent of the people in Group X or employers or customers— or all three groups— end up paying the costs of the alcoholism of 40 percent of the people in Group X

This is certainly not judging each job applicant as an individual, so it is not Discrimination I in the purest sense of Discrimination Ia. On the other hand, it is also not Discrimination II, in the sense of decisions based on a personal bias or antipathy toward that group. The employer might well have personal friends from Group X, based on far more knowledge of those particular individuals than it is possible to get about job applicants, without prohibitive costs.

The point here is neither to justify nor condemn the employer but to classify different decision-making processes, so that their implications and consequences can be analyzed separately. If judging each person as an individual is Discrimination 1a, we can classify as Discrimination 1b basing decisions about groups on information that is correct for that group, though not necessarily correct for every individual in that group, nor necessarily even correct for a majority of the individuals in that group.

A real-life example of the effect of the cost of knowledge in this context is a study which showed that, despite the reluctance of many employers to hire young black males, because a significant proportion of them have criminal records (Discrimination 1b), those particular employers who automatically did criminal background checks on all their employees (Discrimination 1a) tended to hire more young black males than did other employers.1

In other words, where the nature of the work made criminal background checks worth the cost for all employees, it was no longer necessary to use group information to assess whether individual young black job applicants had a criminal background. This made young black job applicants without a criminal background more employable than before.

More is involved here than simply a question of nomenclature. It has implications for practical policies in the real world. Many observers, hoping to help young black males have more employment opportunities, have advocated prohibiting employers from asking job applicants questions about a criminal record. Moreover, the U.S. Equal Employment Opportunity Commission has sued employers who do criminal background checks on job applicants, on grounds that this was racial discrimination, even when it was applied to all job applicants, regardless of race.2 Empirically, however, criminal background checks provided more employment opportunities for young black males.

[1] Harry J. Holzer, Steven Raphael, and Michael A. Stoll, “Perceived Criminality, Criminal Background Checks, and the Racial Hiring Practices of Employers,” Journal of Law and Economics, Vol. 49, No. 2 (October 2006), pp. 452, 473.

[2] Jason L. Riley, “Jobless Blacks Should Cheer Background Checks,” Wall Street Journal, August 23, 2013, p. All; Paul Sperry, “Background Checks Are Racist?” Investor’s Business Daily, March 28, 2014, p. Al.

Thomas Sowell, Discrimination and Disparities (New York, NY: Basic Books, 2018), 23-25 (added references).

Rich or poor, most people agree that wealth disparities exist. Thomas Sowell discusses the origins and impacts of those wealth disparities in his new book, Discrimination and Disparities in this episode of Uncommon Knowledge.

Sowell explains his issues with the relatively new legal standard of “disparate impact” and how it disregards the American legal principle of “burden of proof.” Sowell and Robinson discuss how economic outcomes vary greatly across individuals and groups and that concepts like “disparate impact” fail to take into account these variations.

They chat about the impact of nuclear families on the IQs of individuals, as studies have not only shown that children raised by two parents tend to have higher levels of intelligence but also that first-born and single children have even higher intelligence levels than those of younger siblings, indicating that the time and attention given by parents to their children greatly impacts the child’s future more than factors like race, environment, or genetics. Sowell talks about his book in which he wrote extensively about National Merit Scholarship finalists who more often than not were the first-born or only child in a family.

Sowell and Robinson go on to discuss historical instances of discrimination and how those instances affected economic and social issues within families, including discrimination created by housing laws in the Bay Area. They discuss unemployment rates, violence, the welfare state in regards to African American communities, and more.

Media Predicts Economic Doom for Trump (Patterns)

With economic pundits predicting disaster over the horizon for the Trump economy, Larry decides to compare the doom and gloom to the months prior to the 1992 presidential election, which propelled Bill Clinton to the presidency. Just what were the pundits saying leading up to that election, and what were they saying directly afterwards? How does this parallel the leadup to 2020? Larry answers all these questions and more. He also gives us a peak into a lucrative career path he decided to pass up, despite his obvious talent.

MSNBC’s Chris Hayes Rewrites Economic History

This is an old media created reality that is often repeated by Lefties. How this is still pushed today — to me — is jaw dropping.

And “The Sage” has written well about this:

‘Honest’ PBS Clinton Documentary Lies About the Economy

….In the first hour, the [PBS] documentary stumbled out of the gate. If it were a racehorse, they’d have to put it down. The whopper we get hit with right away and again and again is this: Clinton inherited a recession — not an economy that long ago came out of a recession. Never mind that 1993 — 19 years ago — is within the living memory of many Americans. Yet we are repeatedly told that Clinton entered office under a full-on economic meltdown.

The narrator says: “Heading into the fall [of l992] with the economy still faltering.”

The narrator later says, “As Clinton took office in the winter of 1993, the economic crisis that had propelled him into office showed few signs of abating.”

Treasury Secretary Robert Rubin adds: “We had had a recession. We had high unemployment. And it was a lot of uncertainty about whether the United States was going to get on its feet again or whether we could be in for a prolonged period of real difficulty. So he came into a very difficult environment.”

Journalist Joe Klein describes Clinton’s first budget battle, in the late summer of ’93, as a gamble “in the midst of a recession.”

And midway through the piece, the narrator informs us that “by the fall of 1994, the economy was growing again.”

This is simply extraordinary, mind-boggling.

Whether Bill Clinton was a good president, whether he deserves the credit for balanced budgets and projected surpluses or whether he should have been impeached are matters about which reasonable people can and do disagree. But whether Bill Clinton entered office “in the midst of a recession” and whether, in the fall of ’92 and the winter of ’93, the economy was “still faltering” and “showed few signs of abating” — these are matters of fact.

The National Bureau of Economic Research in Cambridge, Mass., is the official keeper of the U.S. business cycle. It defines a recession as “a period of diminishing [economic] activity.” It tracks when recessions begin (a “peak” — the month when a period of economic growth ends and a downturn begins) and when recessions end (a “trough” — the month when the downturn bottoms out and the economy begins to grow again).

Bill Clinton entered office in January 1993. According to the NBER, did he inherit a recession? Not even close. The recession began in July 1990 and ended eight months later, in March 1991 — a full 19 months before Clinton was even elected.

Let’s be charitable. Perhaps the documentary used a different definition of recession. True, some experts use another standard: two consecutive quarters of negative economic growth. But during Bush-41’s last year in office — 1992, the year voters elected Clinton — the economy grew every quarter, averaging 3.2 percent.

But today, nearly two decades after the fact, the PBS narrator solemnly states that “as Clinton took office in the winter of 1993, the economic crisis that had propelled him into office showed few signs of abating” — even though the economy was then on its 22nd consecutive month of positive growth!

Really? “In the winter of 1993…the economic crisis…showed few signs of abating”? Jan. 29, 1993, seven days after Clinton took office, The New York Times wrote, “U.S. Says Economy Grew at Fast Pace in Fourth Quarter: The economy grew at a faster-than-expected annual rate of 3.8 percent in the final quarter of 1992, the strongest performance in four years, the Commerce Department reported today.”

The confusion is understandable. Many in the media suffer from CRAP — Clinton Recession Amnesia Problem. CRAP spares few victims. Take MSNBC’s Rachel Maddow, who once said she knows little about economics and, bless her, seems determined to prove it. In January 2009, the month President Obama took office, Maddow said: “Clinton took the oath during an economic downturn [emphasis added], but that was a romper room compared to today’s down-crash.”

In October 1992, as President George Herbert Walker Bush ran for re-election against Bill Clinton, the economy was 18 months into a recovery. But as Investor’s Business Daily noted, 90 percent of the newspaper stories on the economy were negative. Yet the following month, when Clinton defeated Bush-41, suddenly only 14 percent of economic news stories were negative!

Given the media recitation of the false history of the state of the 1992/1993 economy — when Clinton entered office — why expect PBS to get it right?…….

My previous post regarding the PBS “Documentary”


In a great example of how the media guides it’s listeners down a path full of narratives they [said media] wish were true… we find in a touted “honest” Clinton documentary many lies and missteps (Clinton | American Experience). Larry Elder is in his element here as he excoriates the depths of this false narrative. His article is a must read for those interested in this. Near the back-half of the audio Larry offers other media silence on issues surrounding Democrats. They [Democrats] apparently have a no fly zone in regard to honest reporting.

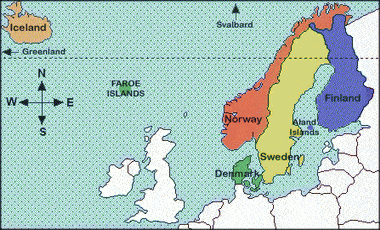
Scandinavian Socialism (Stossel Update)

WATCH the documentary on Amazon Prime: “Sweden: Lessons for America?” (1-hour)

(Jump to the challenges directed at me dealing with America protecting these smaller countries)

The Myth

Gay Patriot introduces us to the myth often put forward by the left. This post by Gay Patriot will add to the video by Bill Whittle that follows it:

One of the myths Progressive Leftists elevate to “fact” by constantly repeating it to each other is the idea that Scandinavian countries are the closest on Earth fulfillment to their socialist dream utopia. ~ Gay patriot

…continuing…

Scandinavian Hell

Kyle Smith, writing in the NY Post, digs a little deeper and discovers that, like almost everything Progressive leftists believe, the Myth of Scandinavian Utopia really is as much a myth as the college rape epidemic, the genius of Barack Obama, or the popularity of gun control.

Visitors say Danes are joyless to be around. Denmark suffers from high rates of alcoholism. In its use of antidepressants it ranks fourth in the world. (Its fellow Nordics the Icelanders are in front by a wide margin.) Some 5 percent of Danish men have had sex with an animal. Denmark’s productivity is in decline, its workers put in only 28 hours a week, and everybody you meet seems to have a government job. Oh, and as The Telegraph put it, it’s “the cancer capital of the world.”

So how happy can these drunk, depressed, lazy, tumor-ridden, pig-bonking bureaucrats really be?

I think my favorite paragraph is where he cites the Scandinavian Social Contract as the “Ten Commandments of Buzzkill.”

“You shall not believe that you are someone,” goes one. “You shall not believe that you are as good as we are,” is another. Others included “You shall not believe that you are going to amount to anything,” “You shall not believe that you are more important than we are” and “You shall not laugh at us.”

They read like the 10 Commandments of Progressive Leftism…

…read it all…

Economics 101

In an excellent Bloomberg article entitled, “Booming Sweden’s Free-Market Solution,” the myth is dismantled in toto by Anders Aslund. Here is a snippet:

…From 1970 until 1989, taxes rose exorbitantly, killing private initiative, while entitlements became excessive. Laws were often altered and became unpredictable. As a consequence, Sweden endured two decades of low growth. In 1991-93, the country suffered a severe crash in real estate and banking that reduced GDP by 6 percent. Public spending had surged to 71.7 percent of GDP in 1993, and the budget deficit reached 11 percent of GDP.

TURNING POINT
The combination of the crisis and the non-socialist government under Carl Bildt from 1991 to 1994 broke the trend and turned the country around. In 1994, the Social Democrats returned to power and stayed until 2006. Instead of revoking the changes, they completed the fiscal tightening. In 2006, a non-socialist government returned, and Finance Minister Anders Borg, with his trademark ponytail and earring, has led further reforms. Sweden successfully weathered the global financial crisis that started in 2008, and the Financial Times named Borg Europe’s best finance minister last year.

Before 2009, Sweden had a budget surplus, and it has one again. For the past two years, economic growth has been 4 percent on average, and the current-account surplus was 6.7 percent in 2011. The only concerns are the depressed demand for exports caused by the current euro crisis and an unemployment rate that is about 7.5 percent.

Sweden’s traditional scourge is taxes, which used to be the highest in the world. The current government has cut them every year and abolished wealth taxes. Inheritance and gift taxes are also gone. Until 1990, the maximum marginal income tax rate was 90 percent. Today, it is 56.5 percent. That is still one of the world’s highest, after Belgium’s 59.4 and there is strong public support for a cut to 50 percent.

The 26 percent tax on corporate profits may seem reasonable from an American perspective, but Swedish business leaders want to reduce it to 20 percent. Tax competition is fierce in some parts of Europe. Most East European countries, for example, have slashed corporate taxes to 15-19 percent….

Reason.org Weighs in on the “Swedish” experiment, how it got its wealth, noting how it squandered it, and how it is returning to the pre-70’s ideology:

  • Sweden is a powerful example of the importance of public policy. The Nordic nation became rich between 1870 and 1970 when government was very small, but then began to stagnate as welfare state policies were implemented in the 1970s and 1980s. The CF&P Foundation video explains that Sweden is now shifting back to economic freedom in hopes of undoing the damage caused by an excessive welfare state.

And do not think for a moment that the free-market has not allowed Sweden or other Nordic nations to get back on their feet. This is is pointed out in the following “101” presentation on economics:

The Above Video Description via Reason.org:

For those of us who place more trust in free markets than state-directed economies, we must inevitably (and repeatedly) confront the skeptical interlocutor who details the “successes” of Swedish social democracy. “If state intervention into the economy is so bad, high taxes so destructive, then why is Sweden such a success?” It’s an irritatingly simple question with a incredibly complicated answer, though I do recommend pointing out, when the conversation turns to health care and secondary education, that nothing, in a state the confiscates a massive portion of your income, is “free.” But as many have pointed out, during its boom years, Sweden was a pretty free market place; from the 1970s through the 1990s—when taxes and regulation dramatically increased—the economy slowed until it spun out in the early 1990s…

[….]

…So here is my bottom line: When some American pundit, with expertise is everything, explains why some European welfare state “works,” or how everything you know is wrong about taxing income at 75 percent, do a little digging, make use of Google Translate, and don’t trust that, because Swedes and Danes tell researchers that they are happy, the United States should introduce “daddy leave” and provide subsidies to syndicalist newspapers.

The best English-language explication of the Swedish model comes from my pal Johan Norberg, who wrote this brilliant piece for The National Interest a few years back. And watch my interview with Norberg on Swedish welfare politics here and on Naomi Klein here.

The following interview is Johan Norberg, author of In Defense of Global Capitalism, sits down with reason.tv’s Michael C. Moynihan to sort out the myths of the Sweden’s welfare state, health services, tax rates, and its status as the “most successful society the world has ever known.”

National Review seems like a good place to continue the theme of showing how the Nordic countries have used the free-market system to recoup what it has lost with previous regulations that crippled free-enterprise. Here is a comparison between Sweden and Venzuala that was helpful in explaining how Sweden has less regulations that us in many places (a recent phenomenon BTW):

Talk to a Bernie Sanders voter about “socialism” — and they can be very insistent about using the word — and you’ll get paeans to Sweden, which is not a socialist country but a country with large, expensive welfare state. The distinction is not trivial: There is relatively little in the way of state-run enterprise in Sweden; the Swedish government is in fact only a 60 percent partner in the postal service. The Swedish government is, alas, in the casino business, albeit in a more transparent way than American government is. On the Heritage economic-freedom rankings, Sweden isn’t that far behind the United States. It has very high taxes, but taxes are not the only burden that governments put on the economy, not necessarily even the most important, and Sweden outscores the United States on a number of important metrics: free trade, property rights, freedom from corruption, investment freedom, monetary policy, etc. The United States’ small edge in the rankings comes mainly from relatively low taxes and a much less regulated labor market.

Reason.org again weighs in on whether Sweden is the right model for the U.S. to emulate:

The Above Video Description:

To the American mind there may be nothing more quintessentially Swedish than the leggy, blond supermodel.

But there’s another Swedish model that inspires almost as much admiration—the Swedish economic model. With a generous welfare state and high living standards, Sweden seems to prove that socialism works. Much of the hope that swept Barack Obama into the White House rests on the belief that America could reach new heights under a regime of enlightened progressivism, that we could be more like the Swedes.

Not so fast, warns Stockholm University sociologist Charlotta Stern: “If an American told me that the US should be more like Sweden I would say I don’t think it’s possible.” The United States can centralize its health care system and pass other laws that mimic Sweden’s welfare state polices, says Stern, but it’s impossible to replicate a culture that allows those policies to operate about as smoothly as possible. Swedish bureaucracies inspire trust, but their American counterparts (DMV, TSA, IRS) inspire punch lines, if not outrage.

But America could emulate some of the Swedish policies that don’t require extensive bureaucracies. Take school vouchers. Teachers unions in America regard the idea as free-market radicalism, but families in Sweden enjoy universal school choice. Sweden adopted its famously progressive policies during the 1970s, but after years of sluggish economic growth the land of ABBA altered its course in the 1990s, adopting a host of free-market reforms, from deregulation to tax cuts.

Although much of the disco-era welfare state remains, economist Andreas Bergh credits the free market reforms with reviving his nation’s economy. “Sweden is moving in the market economic direction,” says Bergh, “but that does not mean America should be moving in the socialist direction.”

What if the two nations continue on in different directions? Maybe some day when America is looking for a way to rejuvenate its economy, pundits will point to a different kind of Swedish model. One that increases individual choice and competition.

“Sweden—A Supermodel for America?” is produced by Daniel B. Klein, and written and produced by Ted Balaker, who also hosts. Shot by Jonathan Liberman and Henrik Devell, with additional production support by Zach Weissmueller and Sam Corcos and post production by Hawk Jensen and Austin Bragg. Special thanks to Niclas Berggren, Martin Borgs, Nils Karlson, and the Ratio Institute.

A Challenge Directed At Me

In conversation about an audio upload to my YouTube Channel of Dennis Prager discussing Bernie Sanders, I was challenged with this:

  • Sweden is not a Nato member so how does the US pay for Sweden defense? Pointing at Whittle and saying “because he say they do” won’t cut it.

To which I responded with a quote from an International Business Times article:

Finland is joining military exercises with other Scandinavian countries, as well as several members of NATO, in late May, Finnish media report. The maneuvers called Arctic Challenge will span 12 days, starting May 25, and include nine countries and close to 100 planes. The drills, over Sweden and northern Norway, come amid increased tensions between Russia and its Baltic and Nordic neighbors.

Sweden and Switzerland, which like Finland are not members of NATO, are expected to join the exercise, along with NATO members Norway, the Netherlands, Britain, France, Germany and the United States. Finland plans to send 16 F-18 Hornet fighter jets, while the other countries will supply Gripen “multirole” fighters, F-16s, Eurofighters and Jet Falcons, as well as transports and tankers, Russian news agency Sputnik reported. The Norwegian armed forces said the purpose of the Arctic Challenge exercise is to “learn to coordinate efforts in complicated flight operations conducted in cooperation with NATO.”

Russia has ramped up military activity along its borders with northern Europe, causing consternation in several Baltic and Nordic countries and pre-emptive actions to head off — or prepare for — a possible military crisis. Latvia, which reported a Russian submarine near its coast in mid-March, is beefing up security on its eastern border, while Finland recently began a letter campaign notifying some 900,000 reservists of their duties in a potential crisis. Sweden also intercepted four Russian planes flying over the Baltic Sea in March with their radios off. Russian jets have been intercepted in other instances while flying in European international airspace….

I also pointed out that this promise went back to the Cold War, and was not known about till a Swedish defense think-tank/security firm uncovered the agreements in 1994. The original story’s link has been lost, but it is here on FOI’s site. FOI’s “about us” page has this:

  • FOI is one of Europe’s leading research institutes in the areas of defence and security. We have 1,000 highly skilled employees with various backgrounds. At FOI, you will find everything from physicists, chemists, engineers, social scientists, mathematicians and philosophers to lawyers, economists and IT technicians…. The Armed Forces and the Swedish Defence Material Administration are our main customers. However, we also accept assignments from civil authorities and industry. Our clients from the defence sector place very high demands on advanced research, which also benefits other customers.

Here is the info from the old article via WIKI:

Initially after the end of World War II, Sweden quietly pursued an aggressive independent nuclear weapons program involving plutonium production and nuclear secrets acquisition from all nuclear powers, until the 1960s, when it was abandoned as cost-prohibitive. During the Cold War Sweden appeared to maintain a dual approach to thermonuclear weapons. Publicly, the strict neutrality policy was forcefully maintained, but unofficially strong ties were purportedly kept with the U.S. It was hoped that the U.S. would use conventional and nuclear weapons to strike at Soviet staging areas in the occupied Baltic states in case of a Soviet attack on Sweden. Over time and due to the official neutrality policy, fewer and fewer Swedish military officials were aware of the military cooperation with the west, making such cooperation in the event of war increasingly difficult. At the same time Swedish defensive planning was completely based on help from abroad in the event of war. Later research has shown that every publicly available war-game training, included the scenario that Sweden was under attack from the Soviets, and would rely on NATO forces for defence. The fact that it was not permissible to mention this aloud eventually led to the Swedish armed forces becoming highly misbalanced. For example, a strong ability to defend against an amphibious invasion was maintained, while an ability to strike at inland staging areas was almost completely absent.

In the early 1960s U.S. nuclear submarines armed with mid-range nuclear missiles of type Polaris A-1 were deployed outside the Swedish west coast. Range and safety considerations made this a good area from which to launch a retaliatory nuclear strike on Moscow. The submarines had to be very close to the Swedish coast to hit their intended targets though. As a consequence of this, in 1960, the same year that the submarines were first deployed, the U.S. provided Sweden with a military security guarantee. The U.S. promised to provide military force in aid of Sweden in case of Soviet aggression. This guarantee was kept from the Swedish public until 1994, when a Swedish research commission found evidence for it. As part of the military cooperation the U.S. provided much help in the development of the Saab 37 Viggen, as a strong Swedish air force was seen as necessary to keep Soviet anti-submarine aircraft from operating in the missile launch area. In return Swedish scientists at the Royal Institute of Technology made considerable contributions to enhancing the targeting performance of the Polaris missiles.

Some More Discussion

In this first back-and-forth, I noted some of the above and got this response:

  • Seems Sweden is searching for the viable balance of Capitalism and Socialism. Good for them. Bernie Sanders seeks the same.

To which I respond:

They want [and have] a lower tax rate than Sanders wants. They dumped their “wealth tax” and “death tax.” They lowered their corporate tax-rate and want it at 20% and below. Lessened regulations on businesses… on-and-on.

Bernie wants the 70’s through 90’s Sweden… I am down with the 2006 and beyond Sweden.

Someone else joined the discussion, and mentioned the following:

  • My family is Swedish and I can tell you with 100% accuracy they are way better off than we are…. Across the board pretty much.

Again, I respond:

There is a Swedish economist in the post that from first hand experience (and expertise in his field) telling you they are where they are because of the free market and a reduction [greatly] of the welfare state/socialism enterprise. [And, BTW, they use the many life saving drugs produced by the profit motivated “Big Pharma” spending on R&D to extend the lives of their fellow Swedes.]

When you get all these health care services for “free” then people start taking them for granted, calling ambulances without second thoughts, and going to the doctor for simple things that you don’t really need to see a doctor for… False alarms for ambulances and fire trucks end up costing the government and indirectly tax payers huge amounts of money every year. Which is why Sweden has as of late started to reform its health care system by privatizing parts of it. Mind you, these are somewhat limited in scope, but people are able to pay now for private care (1-in-10 now have private insurance/health-care).


…The paradox is that America has been doubling down on government authority over healthcare with the Affordable Care Act, just as more and more European governments, including Denmark, England, Finland, Ireland, Italy, the Netherlands, Norway, Spain, and Sweden, have been forced by public outcry to address the unconscionable waits for care by introducing new laws. But it is even more essential for American voters to realize, and for our government leaders to acknowledge, what other countries are beginning to recognize all over the world. These governments have started to understand that the cure for their failed nationalized health systems is a shift to privatization. And citizens under government-dominated health systems are increasingly circumventing their own systems, pursuing private healthcare to solve the uniformly poor access to care and limited choices.

Let’s consider Sweden, often heralded as the paradigm of a successful welfare state. The facts tell a very different story. Having failed its citizens in healthcare access, the Swedish government has aggressively introduced private market forces into healthcare to improve access, quality, and choices. Although once entirely public, over a quarter of Swedish primary care clinics are now run by the private sector. Sweden’s municipality governments have increased spending on private care contracts by 50% in the past decade. Private nursing facilities now receive substantial public funding to care for patients. Widespread private sector competition has also been introduced into pharmacies to tear down the pre-2009 monopoly over all prescription and non-prescription drugs. Since the Swedish government sold over half of its pharmacies to private firms in 2009, 20 private firms entered the market and over 300 new pharmacies opened, not only improving accessibility but providing the first pharmacies ever to many small towns.

Moreover, despite the fact that an average Swedish family already pays nearly $20,000 annually in taxes toward healthcare according to Swedish economist Per Bylund, about 12% of working adults bought private insurance in 2013, a number that has increased by 67% over the last five years. Half a million Swedes now use private insurance, up from 100,000 a decade ago, even though they are already “guaranteed” public healthcare….

(Hoover Insitute, “Defining Ideas: The Surprising International Consensus on Healthcare“)

Gay Patriot ends the beginning of this post well:

…In the pre-Reagan Era, the media was just as left-leaning and reluctant to discuss the poverty and oppression that permeated the Soviet Union. But there were enough people willing to talk about it outside the media for the truth to get out. The pervasiveness of social media should make it easier, not harder, for conservatives to get a message out around the media gatekeepers. Millennials should be told what happened in Venezuela after his ideological brother Hugo Chavez took over; they should be told how toilet paper became a black market commodity and supermarket shelves became bare. And they should be made aware that Sweden is not quite the utopia they’ve been taught it is, either.

NRA Political Donations Myth

THINK PROGRESS, a Leftist organization, back in 2012 went on to prove the following:

In a series of posts for Think Progress beginning today, I’ll detail what the data on the NRA’s involvement in elections actually tells us, and what conclusions we can draw about the status of an issue that has been largely dormant in our politics in recent years. The results of this analysis include the following:

  • NRA contributions to candidates have virtually no impact on the outcome of Congressional races.
  • An NRA independent expenditure (IE) campaign does not improve a candidate’s chance of winning.
  • The NRA’s endorsement, so eagerly sought by so many candidates, has almost no impact on the outcome of elections; the bulk of NRA endorsements go to incumbent Republicans with almost no chance of losing.
  • Despite what the NRA has long claimed, it neither delivered Congress to the Republican party in 1994 nor delivered the White House to George W. Bush in 2000.

[…..]

In a more recent post, GUNMART notes the under-funding of gun issues:

The liberal lie of the ‘Big Money NRA’ buying congress and funding their way to controlling our laws is a myth. Here is a look at the stats…

Now look at those dollar amount from those top special interests and compare and contrast those numbers to what the NRA’s real financial power isThey come in with a ranking of only 155th place among top lobbyists and 464th place among top contributions.


Trump Gets No Love – Larry Elder

By the way, for any squishy Leftists reading this…. the “love” Larry Elder mentions is not the emotional kind (like when someone has “puppy love”).  This is the deeper issue of the media and it’s bias guiding American thought. From winning pulitzer prizes for hiding 5-million deaths by starvation in a single year by the USSR, from leading Democrats personally asking the Kremlin for help in defeating Reagan, to bar code reader lies being used to make Republican’s look dumb to negative comments on the economy when a Republican is in office to when a Democrat takes over and the economy doesn’t change one iota but the press calls it wonderful. Or when PBS does a “truthful” hard hitting documentary on bill Clinton and LIES about the economy involved… this is the “love” Larry Elder tweeted on:

10 Myths About Government Debt

Myth 1 is that the government owes “only” $20 trillion. (In reality, it’s much more.) But luckily, Myth 10 is that there’s no way to fix this problem… Prof. Antony Davies explains.

(MOONBATTERY) Most everyone is aware that the federal debt is a serious problem, but most don’t realize how serious, because they believe in some of the 10 myths economics professor Antony Davies of Duquesne University debunks in the video below:

1. The government owes only $20 trillion.
2. The government owes only $150 trillion.
3. Money borrowed from Social Security isn’t really debt because we owe it to ourselves.
4. The government cannot go bankrupt.
5. The government can solve its financial problems by raising taxes.
6. The rich aren’t paying their fair share.
7. The government could settle its debts by selling off assets.
8. The government needs to pay off its debts.
9. The government can just keep borrowing.
10. There is no way to fix the problem.

Trickle Down Economics Myth |Updated|

Here are some excerpts of Thomas Sowell’s article, the TRICKLE DOWN LIE (emphasis added):

New York’s new mayor, Bill de Blasio, in his inaugural speech, denounced people “on the far right” who “continue to preach the virtue of trickle-down economics.” According to Mayor de Blasio, “They believe that the way to move forward is to give more to the most fortunate, and that somehow the benefits will work their way down to everyone else.”

If there is ever a contest for the biggest lie in politics, this one should be a top contender.

While there have been all too many lies told in politics, most have some little tiny fraction of truth in them, to make them seem plausible. But the “trickle-down” lie is 100 percent lie.

It should win the contest both because of its purity — no contaminating speck of truth — and because of how many people have repeated it over the years, without any evidence being asked for or given…

[….]

…Back in 2008, presidential candidate Barack Obama attacked what he called “an economic philosophy” which “says we should give more and more to those with the most and hope that prosperity trickles down to everyone else.”

Let’s do something completely unexpected: Let’s stop and think. Why would anyone advocate that we “give” something to A in hopes that it would trickle down to B? Why in the world would any sane person not give it to B and cut out the middleman? But all this is moot, because there was no trickle-down theory about giving something to anybody in the first place.

The “trickle-down” theory cannot be found in even the most voluminous scholarly studies of economic theories — including J.A. Schumpeter’s monumental “History of Economic Analysis.”

[….]

But, contrary to Mayor de Blasio, this is not a view confined to people on the “far right.” Such liberal icons as Presidents John F. Kennedy and Woodrow Wilson likewise argued that tax rates can be so high that they have an adverse effect on the economy.

In his 1919 address to Congress, Woodrow Wilson warned that, at some point, “high rates of income and profits taxes discourage energy, remove the incentive to new enterprise, encourage extravagant expenditures, and produce industrial stagnation with consequent unemployment and other attendant evils.”

In a 1962 address to Congress, John F. Kennedy said, “it is a paradoxical truth that tax rates are too high today and tax revenues are too low and the soundest way to raise the revenues in the long run is to cut the rates now.”

This was not a new idea. John Maynard Keynes said, back in 1933, that “taxation may be so high as to defeat its object,” that in the long run, a reduction of the tax rate “will run a better chance, than an increase, of balancing the budget.” And Keynes was not on “the far right” either.

The time is long overdue for people to ask themselves why it is necessary for those on the left to make up a lie if what they believe in is true.

Below are two short clips regarding “Trickle Down.” One is a clip from Sowell’s audio book, “Basic Economics A Citizen’s Guide to the Economy 2nd Edition” (left – 4:25 minutes). The other is the same info but during an interview (right – 3:08 minutes):

HERE is the entire “Uncommon Knowledge” interview discussing “Trickle Down” rhetoric and “Taxing the Rich.” BELOW is a Reagan myth exploded in an interview of Tavis Smiley by Larry Elder:


~ BONUS ~


Corporations Pay ZERO% In Taxes

I feel like I shouldn’t have to upload this ECON 101 type stuff, however, many may not realize this fact… ESPECIALLY if they went to college. I clip Dennis Prager noting this truth and then add a classic from Milton Friedman (longer video is HERE). See as well Congressman Bill Posey make the same point on the House floor.

Zero Sum Myth

See Also: “Why Capitalism Works

Capitalism, the exchange of markets did this:

  • Since Deng Xiaoping began instituting market reforms in the late 1970s, China has been among the most rapidly growing economies in the world, regularly exceeding 10 percent GDP growth annually. This growth has led to a substantial increase in real living standards and a marked decline in poverty. Between 1981 and 2008, the proportion of China’s population living on less than $1.25/day is estimated to have fallen from 85% to 13.1%, meaning that roughly 600 million people were taken out of poverty.

Wealth and Wealth Creation IS NOT a zero sum game!

The Zero-Sum Game Myth

There are three kinds of games: win-lose, lose-lose, and win-win. Win-lose games, like basketball, are sometimes called “zero-sum games.” When the Celtics and the Bulls compete, if the Celtics are up, then the Bulls are down, and vice versa. The scales balance. It’s a zero-sum.

Besides lose-lose games, which most of us avoid, there are positive-sum or win-win games. In these games, some players may end up better off than others, but everyone ends up at least the same if not better off than they were at the beginning.

Millions of people think that free trade is a dog-eat-dog competition, where winners always create losers. This is the zero-sum game myth, which leads many to think that the government should somehow redistribute wealth. While some competition is a part of any economy, of course, an exchange that is free on both sides, in which no one is forced or tricked into participating, is a win-win game. When I pay my barber $18 for a haircut, I value the haircut more than the $18. My barber values the $18 more than the time and effort it took her to cut my hair. We’re both better off. Win-win….

Forbes:

…This leads nicely into the third point: wealth is not a zero sum game. This is economist jargon meaning everyone can win. Look again at the chart Gary Burtless put together. You will note that all segments of American society saw their incomes rise except the top one percent. If we had the data to do the chart again through 2014, we would see that everybody had higher incomes than fifteen years ago.

And this win-win idea is not just in terms of income. In a capitalist society, people get rich by making somebody else better off. J. K. Rowling became one of the richest women in the world by writing the Harry Potter series of books. All the people who bought the books believed that the books were worth more than the sale price otherwise they would not have bought it. Thus, J.K. Rowling wins and all her readers win. Both sides of a voluntary transaction are made better off. As long as government coercion is not involved, when you see someone getting rich, you know a lot of people are being made happy….