Leonardo DiCaprio ~ The 2015 “Boob” Award

“For such a model there is no need to ask the question ‘Is the model true?’. If ‘truth’ is to be the ‘whole truth’ the answer must be ‘No’. The only question of interest is ‘Is the model illuminating and useful?’”

  • Restated: “All models are wrong; some are useful.”
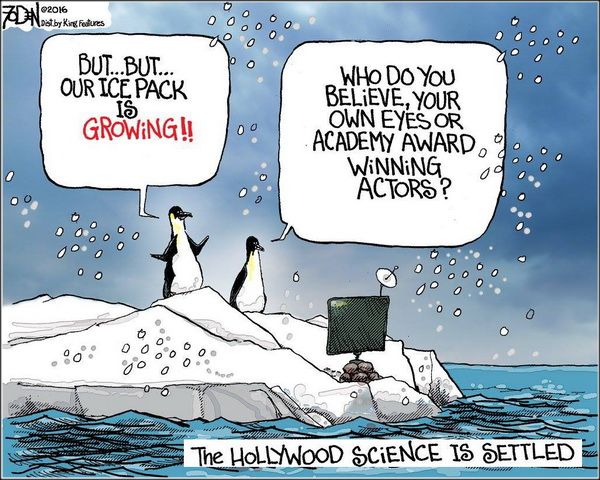
(WUWT)

  • JoNova wriley says, “He [DiCaprio] may feel the heat, but the satellites didn’t ‘feel’ a record, and nor would ice cores, stalagmites, corals, sediments, or any other part of the natural world that has existed for longer than 41 years. Meh.”

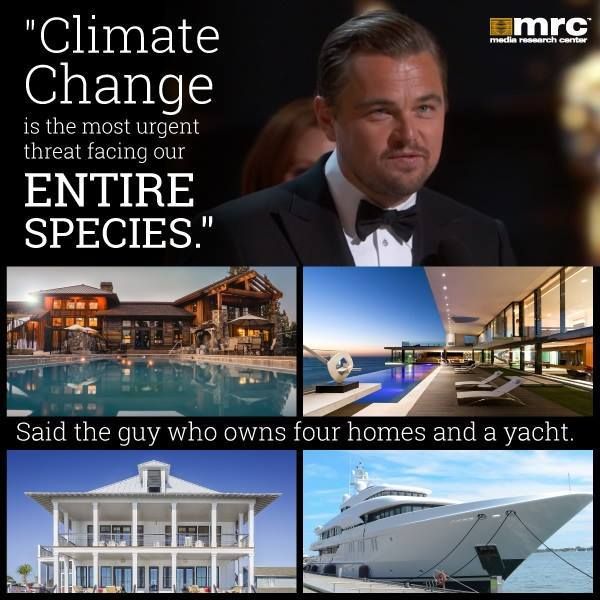
Leonardo DiCaprio is even considering quitting acting to battle global warming. What a boob. Keep in mind NASA came out early to say 2014 was the warmest on record… and they retracted that [sorta] by saying, “NASA climate scientists: We said 2014 was the warmest year on record… but we’re only 38% sure we were right.” (As a relevant side note, now even Michael Mann admits the almost 19-year PAUSE is in fact real.)

Here, Reason Magazine notes the silliness just in satellite data (which started in 1979) in regards to DiCaprio’s statement above:

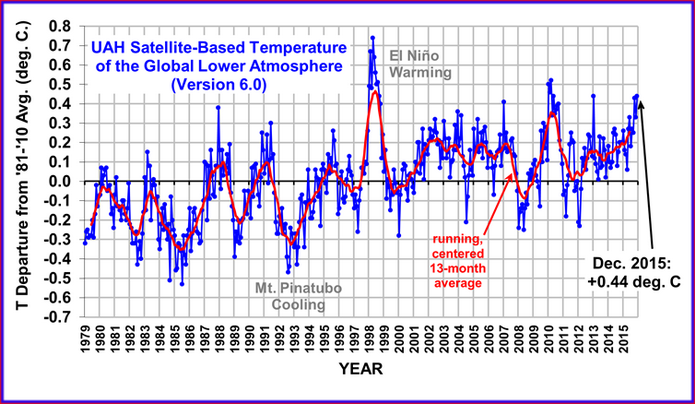
…satellite temperature data from climatologists at the University of Alabama in Huntsville suggest that 2015 was third warmest year since 1979 when satellite measurements began. The past year was particularly warm because of a large El Nino in the Pacific Ocean in which a massive amount of warm water sloshes toward South America from Asia. The phenomenon warms the atmosphere, but now appears to be fading which suggests that 2016 will be cooler than last year. 

Forbes notes,

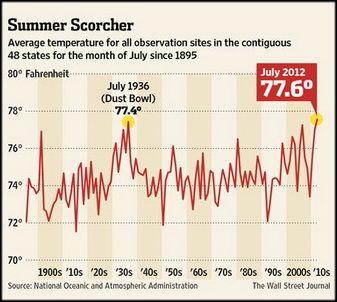
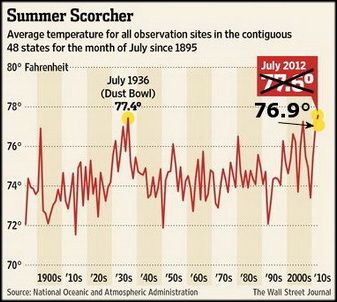
Satellite temperature readings going back to 1979 show 1998 was by far the warmest year in the satellite era, followed by 2010. 2015 comes in third. And these results are only for the period since 1979.

2015 should have been warmer. This past year saw what is likely the most powerful El Nino during the satellite temperature record. With a record El Nino, we should have experienced record high temperatures. Yet we didn’t.

A record El Nino resulting in less-than-record temperatures is another sign that global warming is not all that activists crack it up to be. Indeed, if a record strong El Nino cannot bring global temperatures back to the warmth of 1998, what can – and when will that be? 18 years after 1998, global warming still has not created the runaway warming we were told to expect.

(Foden Toons of Facebook)

What else is DiCaprio wrong on? Reason continues with him,

DiCaprio expressed his concern for how climate change will deleteriously affect “indigenous people of the world, for the billions and billions of underprivileged people.” First, the good news is that the World Bank reports that absolute poverty (defined as living on less than $1.90 per day) has now fallen below 10 percent of the world’s population. The global rate of absolute poverty was 37 percent as recently as 1990. In large measure this amazing improvement in poverty rates stems from hundreds of millions of poor people gaining access to modern energy supplies. Total electric generating capacity has more than doubled since 1990 and most of that energy is produced by burning fossil fuels. DiCaprio would be better advised to direct his aid toward connecting the 1.2 billion underprivileged people who are still without electricity to modern power plants.

The Canadian Broadcasting Center noted that “The 41-year-old actor again highlighted his experience of a sudden change in temperature and loss of snow while filming The Revenant in southern Alberta as evidence of a warming globe.” One person at WUWT notes:

The key word here is “again”.

After the general hilarity that ensued his first blunder, Di Caprio’s handlers must have told him he made quite a basic mistake. So to see this 41 y old multi millionaire once again tell the world such a blatant idiotic line means that either he is an idiot or he is a dishonest advocate, for whom everything, or anything, is good to advance his proselytism, regardless of truth.

To end — again — with JoNova‘s comment, “He [DiCaprio] may feel the heat, but the satellites didn’t ‘feel’ a record, and nor would ice cores, stalagmites, corals, sediments, or any other part of the natural world that has existed for longer than 41 years. Meh.”

Truth doesn’t matter if you are rich, apparently, of a leftist. This has in the past led to great pains.

Failed Predictions About Polar Bears

Here are 5 or the 10 failed predictions regarding Polar Bears via What’s Up With That?

Prediction 1. Western Hudson Bay (WHB) polar bear numbers will continue to decline beyond 2004 due to ever-earlier breakup and ever-later freeze-up of sea ice.

FAIL – An aerial survey conducted by Seth Stapleton and colleagues (2014) in 2011 produced an estimate of about 1030 bears and their report stated:

This figure is similar to a 2004 mark–recapture estimate but higher than projections indicating declining abundance since then.”

This 1030 figure is the one being used by the IUCN PBSG and Environment Canada for WHB, as a limited mark-recapture study conducted the same year (Lunn and colleagues 2014) did not survey the entire WHB region and therefore not comparable to the 2004 count.

Prediction 2. Breakup of sea ice in Western Hudson Bay (WHB) will come progressively earlier and freeze-up dates progressively later (after 1999), as CO2 levels from burning fossil fuel increase global temperatures.

FAIL – Researchers Nick Lunn and colleagues (2014) determined that there has been no trend in breakup or freeze-up dates between 2001 and 2010. While no analyses of breakup or freeze-up dates for WHB since 2010 have been published, this pattern seems to have continued to at least 2015.

Prediction 3. Chukchi Sea polar bears will be the most harmed by summer sea ice declines because they experience some of the largest sea ice losses of any subpopulation (and thus, the longest open-water season each year).

FAILA recent study of Chukchi bears (2008-2011) found them in better condition than they were in the 1980s when summer open-water seasons were short – indeed, only Foxe Basin bears were fatter than Chukchi bears. They were also reproducing well (Rode et al. 2010, 2013, 2014), with some females raising litters of triplets (see lead photo), a rare sight outside Western Hudson Bay.

Prediction 4. Cannibalism will increase as summer sea ice extent declines worsen.

FAIL – Cannibalism is a natural phenomenon in polar bears and none of the few incidents reported recently have involved obviously thin or starving polar bears (even the most recent example, filmed in mid-August 2015 in Baffin Bay when sea ice levels in the region were high), despite the fact that 2012 recorded the lowest summer ice extent since 1979. Incidents of cannibalism cannot be said to be increasing because there is no scientific baseline to which recent occurrences can be compared.

Prediction 5. Drowning deaths of polar bears will increase as summer sea ice continues to decline (driven home by a high-profile incident in 2004).

FAIL – There have been no further confirmed reports of polar bear drowning deaths associated with extensive open water swimming since that contentious 2004 event, even though the two lowest extents of summer sea ice have occurred since then (2007 and 2012). A more rigorous study of swimming prowess found polar bears, including cubs, are capable of successfully making long-distance swims.  Indeed, challenging open-water swims don’t happen only in summer: in late March 2015, a polar bear swam through open water from the pack ice off Newfoundland to the Hibernia oil platform well offshore.

(…read the other five…)

February Hot? Sorta

See another person challenging me with a “warm Christmas

(As usual, all “my” graphs are linked to their origins)

Someone just mentioned to me:

  • I don’t want to get you all revved up here….. but……. don’t you think 85 degrees in February is a bit, um, weird?

Nah, it’s normal.

It is funny, whenever I point out record cold winters or summers as proof against AGW, I hear — “you don’t know the difference between ‘climate’ and ‘weather’.” 

But warm spells prove what then? Anyhew:

February Warm Global Warming

Weather changes all the time all across the globe. Has the earth gotten warmer since the ice-age? Yes. Outside of people tampering with ground stations while ignoring satellite data, we haven’t experienced warming in quite a while. What seems abnormal however, is that the theory behind C02 is failing miserably:

1. The Mean Global Temperature has been stable since 1997, despite a continuous increase of the CO2 content of the air: how could one say that the increase of the CO2 content of the air is the cause of the increase of the temperature? (discussion: p. 4)

2. 57% of the cumulative anthropic emissions since the beginning of the Industrial revolution have been emitted since 1997, but the temperature has been stable. How to uphold that anthropic CO2 emissions (or anthropic cumulative emissions) cause an increase of the Mean Global Temperature?

More on the temperature records of the past via WUWT:state_records_table2

…In Table 2 [graph to the right], we’ve compiled the top five years when the most records were set. When multiple years tie for the high, each individual year gets a fraction of a “record”. So, for example, 1954 and 1933 each get a half of a record for Colorado.

But this doesn’t stop people from implying that last week’s heat wave as an indication that global warming is leading to unprecedented conditions.

US temperatures peaked in the 1930’s, and have never come close again!

screenhunter_35-feb-14-23-36

Two more examples:

  • July 1936 NYC got the all time record max temp there at 106°F. No other day has beat it since. 104 is the closest they came in 1977 and 2011.
  • Philly warmest temp in July on record is 104° set in 1936 tied in 1966. It’s also the 2nd all time warmest temp. August 1918 was all time record 106°.

Both locations records go back to 1871 & 1873

See more February stuff via Boulder Colorado:

BOULDER_CO_DaysAboveMaximumTemperatureThreshold60F_Feb_Feb_1895_2016-1024x459

And how-bout those plummeting summer temps in Wisconsin?

FONDDULAC_WI_DaysAboveMaximumTemperatureThreshold90F_Jan_Dec_1895_2015

Washington averages 6 days over 95 degrees per year, but since la petite cochonne sweated for the cameras, there have only been three 95 degree days in DC. Two in 2013, one in 2014 and none in 2015.

BELTSVILLE_MD_DaysAboveMaximumTemperatureThreshold95F_Jan_Dec_1895_2015-1024x459

Satellite Data Shred Global Warming Claims (Updated)

The only way the “warmists” get the high temps they do, is when they use (and fudge) the very unreliable land temps at stations [most in fact] that are in areas that add an artificial heat to the real temperature.

  • NOAA’s adjustments to previous ocean temperatures between 1998 and 2012 made recent global temperature changes appear more than twice warmer than the original records showed (Dr. Larry Bell, NewsMax)
  • “To manufacture warming during the hiatus, NOAA adjusted the pre-hiatus data downward” (Daily Caller)

REAL SCIENCE notes that before “the year 2000, NASA showed US temperatures cooling since the 1930’s, and 1934 much warmer than 1998.” Continuing RL says:

  • Right after the year 2000, NASA and NOAA dramatically altered US climate history, making the past much colder and the present much warmer. The animation below shows how NASA cooled 1934 and warmed 1998, to make 1998 the hottest year in US history instead of 1934. This alteration turned a long term cooling trend since 1930 into a warming trend.

However, a stark contrast to now is still wrapped up in this graph:

NOAA/NASA use only land-based temps to claim 2015 hottest year ever

Using data from heavily adjusted land-based temperature readings, NOAA and NASA declared yesterday 2015 to be the ‘hottest year ever,’ even though they’ve excluded the satellite record, and worse, ocean temperatures. That’s important because “70 percent of the Earth is oceans,” and “we can’t measure those temperatures very well,” says MIT’s Dr. Richard Lindzen. “The ocean temps can also be “off a half a degree, a quarter of a degree. Even two-10ths of a degree of change would be tiny but two-100ths is ludicrous.”

[….]

As for 2015? The satellite record shows it as being only the third or fourth warmest since satellite tracking began in 1978. The satellite data, which is compiled and maintained by the University of Alabama/Huntsville, found “2015 to be third warmest on record, and Remote Sensing Systems satellite data ranked 2015 as the fourth warmest in the nearly four-decade-old satellite record.”…

(Examiner)

In the above graph, you have lines showing GREAT warming… waaaay above the 30’s to 40’s. HOWEVER, these have been adjusted… that is, the red “raw” data is the ground stations temps… the two lines above it, the blue one (TOBs-Adjusted) and green one (Homogenized) have been monkeyed with. A researcher lightened those lines and put the bolder “pink” and “purple” lines showing data from satellites (NASA). (Much of that blurred out data is milked from measuring units discussed in my post after a Christmas discussion about 2014 being the hottest year on record)

…Just for grins, I plotted the UAH and RSS satellite time series on top of the Hausfather graph…. I think can see why the so-called consensus has become so obsessed recently with destroying the credibility of the satellite data.

(WUWT … read it all for better context)

Now the truth is revealed… in that these persons cannot dabble with the preciseness of the satellite data. And why recent attempts have been to discredit it because it discredits their pet theory.

Climate Depot continues the “heresy”!

NASA and NOAA today proclaimed that 2015 was the ‘hottest year’ on record.

Meanwhile, satellite data shows an 18 plus year standstill in global temperatures.

MIT climate scientist Dr. Richard Lindzen balked at claims of the ‘hottest year’ based on ground based temperature data.

“Frankly, I feel it is proof of dishonesty to argue about things like small fluctuations in temperature or the sign of a trend.  Why lend credibility to this dishonesty?” Lindzen, an emeritus Alfred P. Sloan Professor of Meteorology at the Department of Earth, Atmospheric and Planetary Sciences at MIT, told Climate Depot shortly after the announcements.

“All that matters is that for almost 40 years, model projections have almost all exceeded observations.  Even if all the observed warming were due to greenhouse emissions, it would still point to low sensitivity,” Lindzen continued.

“But, given the ‘pause.’ we know that natural internal variability has to be of the same order as any other process,” Lindzen wrote.

Lindzen has previously mocked ‘warmest’ or ‘hottest’ year proclamations.

“When someone says this is the warmest temperature on record. What are they talking about? It’s just nonsense. This is a very tiny change period,” Lindzen said in November 2015.

Lindzen cautioned: “The most important thing to keep in mind is – when you ask ‘is it warming, is it cooling’, etc.  — is that we are talking about something tiny (temperature changes) and that is the crucial point.”

“And the proof that the uncertainty is tenths of a degree are the adjustments that are being made. If you can adjust temperatures to 2/10ths of a degree, it means it wasn’t certain to 2/10ths of a degree,” he added.

MIT Climate Scientist Dr. Richard Lindzen Mocks ‘Hottest Year’ Claim: ‘Anyone who starts crowing about those numbers shows that they’re putting spin on nothing’

[…..]

A Warm Christmas PROVES Man-Caused Global Warming!

I’m dreaming of a white Christmas, just like the ones Bing Crosby used to sing about — long before anyone talked about global warming and when the only carbon footprints were snow angels in the schoolyard.

But this December, you are more likely to see someone skateboarding than snowboarding in Montreal, which bears no resemblance to a winter wonderland anywhere outside the surreal holiday window display at the downtown Ogilvy store.

[….]

The warmest temperature recorded for Montreal on Dec. 25 was 12.8C in 1964.

Green Christmases are not unheard of in Montreal. In fact, there have been 14 since 1955, according to Environment Canada.

In a recent “conversation,” Timothy mentioned that a warm winter is evidence for man-caused global warming… and you are a “bozo” to deny this:

  • Timothy Kershner [said]: Yes, the climate change denial bozos are the worst of the bunch, Des Andrie. Not sure which part they are in denial of the most. Is it the fact that 60 degrees in the mountains of Pennsylvania isn’t normal on Christmas day…

I merely ask if people like Timothy mention Philadelphia in 2014, which CBS notes set records:

The Winter of 2013-2014 is in the history books. Our latest blast from Mother Nature Tuesday morning brings the season snowfall total in Philadelphia above 58.4″ and it is now officially our third snowiest winter ever.

This is not a record many of us are bragging about. We had those opportunities in 1995-1996 when 65.5″ fell on the city and more recently in 2009-2010 when notable storms like “Snowmageddon” and “Snowpocalypse” helped pile up the all time season record to 78.7″ in Philadelphia….

(See also Accuweather)

When I bring up cold weather I often hear, “you don’t understand ‘weather’ versus ‘climate’.” Likewise, should I say that people like Timothy do not understand weather as opposed to climate?

Bernie Sanders said essentially the same thing, and likewise was torn-up on twitter (Hat-Tip–Weasel):

Young Conservatives notes this disparity between temperatures and global warming activists:

…From Real Science:

Christmas Eve 1955 was much warmer. Three fourths of the country was over 60 degrees, and Ashland Kansas,  Geary Oklahoma and Encinal Texas were all over 90 degrees. Fort Lauderdale was 85 degrees. All of the stations below were over 60 degrees on Christmas Eve, 1955.

Last winter, the East Coast had record cold. That was ignored because it was “less than 1% of the Earth.”  But this week, the Eastern US defines the global climate.

In Irving Berlin’s 1954 musical “White Christmas” – the story line was 70 degrees in Vermont on Christmas eve and no snow. That was why they were “Dreaming of a White Christmas”

So if the warm temperatures this year are because of climate change then what were the high temperatures in 1955 caused by?

Climate change alarmists will use any excuse and any change in weather to blame the world’s problems on pollution but their arguments hold no water when they are even slightly scrutinized….

The No Trick Zone gets in on the action:

At his always interesting Saturday Summary at Weatherbell Analytics here, veteran meteorologist Joe Bastardi confirms what Tony Heller’s Real Science posted a couple of days ago: December 24, 1955 was warmer than the impressively warm December 24, 2015.

It goes to show that you simply cannot judge climate based on a single weather event.

The THREE BIG LIES of 2015

Gay Patriot lists the three BIG LIES he thinks was most pushed by the media establishment and most referenced by Democrats and their lackeys. The entire article should be read, but here are the three (with some YouTube additions):

  • …In 2015, the Democratic Party and its Media Operation collaborated on an unprecdented scale to advance a number of Big Lies in order to advance a sweeping socio-political agenda. Just to name a few:

ONE: The Big Lie of ‘Rape Culture’ – In order to advance the Feminist Transformation, there was a huge push to advance a Narrative that all universities and colleges were essentially Rape Zones where privileged white males raped women at will with no consequences. This lie was advanced by Rolling Stone’s discredited Virginia Tech Gang Rape story, by the completely discredited claim that 1 in 5 college women are raped, and by lying drama queens like Emma “Mattress Girl” Sulkowicz and Lena Dunham. The left advanced this Big Lie in order to advance a comprehensive feminist indoctrination agenda beginning in kindergarten, to shut down criticisms of the radical feminist agenda, and, of course, to label political opponents of the radical feminist agenda as anti-woman. Also, the Rape Culture myth requires universities to create phony-baloney jobs for otherwise unemployable ‘Womyn’s Studies’ majors.

Here the Factual Feminist (one of my favorite authors on feminism) wieghs in:

Dennis Prager reads from Heather Mac Donald’s article in from The City Journal about the “rape culture.” As usual, the left over-exaggerates… and what parent would put their daughter in AP classes to prepare them for the worse crime wave in human history, which is: one-in-five women are rapped at college. OBVIOUSLY the definition is the issue.

As society gets further away from Judeo-Christian norms… more-and-more regret will rear its head from drunken hook-ups.

TWO: Another Big Lie that dominated the culture was the narrative of ‘Racist Cops Gunning Down Innocent Black Men with Impunity.’ This is a useful Big Lie to an administration that seeks to radically alter American society. It advances the myth that the only reason some people don’t achieve as much as other people is because of racism, and the only way to solve that problem is for a massive, all-powerful Government to redistribute wealth from those who have it to those who have been denied it because of racism. This Big Lie was promulgated through the ‘Hands Up, Don’t Shoot myth after the shooting of violent, drug-addled thug Michael Brown and fueled the rise of the violent hate group ‘Black Lives Matter.’ It also allows racial con artists like Shaun King, Ta-Nehisi Coates and DeRay McKesson to become rich.

In pursuit of the leftist agenda to prohibit the private ownership of firearms, the Democrat Media Complex (DMC) has promulgated a mythology worthy of the Church of Scientology. The anti-gun left falsely claimed that mass shootings were a daily occurrence in the USA. Democrat politicians at the highest level repeat the discredited myths such as that gun manufacturers are uniquely immune from liability laws or that 40% of gun sales occur without a background check. The policies intended to be advanced by this mythology have nothing to do with stopping the criminal use of firearms, and everything to do with inhibiting the lawful ownership of firearms by law-abiding citizens. The Democrat Party has rallied to the cause of suspending Due Process and using a secret Government List to deny citizens the Right to Self-Defense, along with other laws that have repeatedly been shown to have no effect on the criminal abuse of firearms.

A magic 50-minutes with Larry Elder. He weaves the reality that the Left can only weave — and that is this:

  • the bankruptcy of and the consequences of the “state” [statist ideology] that came to fruition in Ferguson in the micro via the MACRO application of failed leftist policies! (e.g., the welfare state, subsidizing fatherless-ness, and the funding of programs and pensions via unions and it’s city/state employees.

This third lie is fleshed out well in this article at WUWT, “There Is No Climate Change Disaster Except The One Governments Created.”

Corrupted Data-Sets Due to Equipment Failure/Placement

EQUIPMENT FAIL

Here are some examples of fudged data because of sub-standard equipment:

You’d think the answer would be obvious, but here we have a NOAA operated USHCN climate station of record providing a live experiment. It always helps to illustrate with photos. Today I surveyed a sewage treatment plant, one of 4 stations surveyed today (though I tried for 5) and found that for convenience, they had made a nice concrete walkway to allow servicing the Fisher-Porter rain gauge, which needs a paper punch tape replaced one a month.

Here is what you see in visible light:

Here is what the infrared camera sees:

Note that the concrete surface is around 22-24°C, while the grassy areas are between 12-19°C

This station will be rated a CRN5 by this definition from the NOAA Climate Reference Network handbook, section 2.2.1:

Class 5 (error >~= 5C) – Temperature sensor located next to/above an artificial heating source, such a building, roof top, parking lot, or concrete surface.”

More than half of the stations the NOAA use are tainted or wrongly placed equipment.

CHANGING DATA-SETS

Another example of changing averages was noted by Steve Goddard and others — even the NOAA have acknowledge it — have been discussing recently is exemplified in Dr. Judith Carry’s post on the matter (from a larger post of mine):


Even the Wall Street Journal chose the higher temperature reading to say that July of 2012 was July was the “hottest month in the contiguous U.S. since records began in 1895.” WUWT found this on accident and it has led to quite a few other revelations as we will see. Here is description in part of what we looking at:

Glaring inconsistencies found between State of the Climate (SOTC) reports sent to the press and public and the “official” climate database record for the United States. Using NCDC’s own data, July 2012 can no longer be claimed to be the “hottest month on record”.

[….]

I initially thought this was just some simple arithmetic error or reporting error, a one-off event, but then I began to find it in other months when I compared the output from the NCDC climate database plotter. Here is a table of the differences I found for the last two years between claims made in the SOTC report and the NCDC database output.

[….]

In almost every instance dating back to the inception of the CONUS Tavg value being reported in the SOTC report, there’s a difference. Some are quite significant. In most cases, the database value is cooler than the claim made in the SOTC report. Clearly, it is a systemic issue that spans over two years of reporting to the press and to the public.

It suggests that claims made by NCDC when they send out these SOTC reports aren’t credible because there are such differences between the data. Clearly, NCDC means for the plotter output they link to, to be an official representation to the public, so there cannot be a claim of me using some “not fit for purpose” method to get that data….

The Wall Street Journal made a graph showing this record setting month (below-left). The more accurate temperature for July likewise is shown in the same graph (below-right):

This looking at the data sets chosen and what is used and isn’t used to support an idea that fails in every way. Combine this obvious cherry-picking with the bias, collusion, and charges against the report that the President used to route Congress, all show we have a problem Houston! But this is only the tip of the proverbial iceberg. It seems the NOAA has been skewing these temps for some time. Why? Because the left uses this as a way to promote an ever growing government and the scientists get more-and-more funding. This data fudging story is newer, and it is evolving quickley, including this newest post via Real Science where Steve Goddard notes that More Than 40% Of USHCN Station Data Is Fabricated. Here is Dr. Judith carry’s synopsis (excerpted), in which she critiques a bit Goddard’s post… but then bows to the evidence:

OK, acknowledging that Goddard made some analysis errors, I am still left with some uneasiness about the actual data, and why it keeps changing. For example, Jennifer Marohasy has been writing about Corrupting Australian’s temperature record.

In the midst of preparing this blog post, I received an email from Anthony Watts, suggesting that I hold off on my post since there is some breaking news. Watts pointed me to a post by Paul Homewood entitled Massive Temperature Adjustments At Luling, Texas. Excerpt:

So, I thought it might be worth looking in more detail at a few stations, to see what is going on. In Steve’s post, mentioned above, he links to the USHCN Final dataset for monthly temperatures, making the point that approx 40% of these monthly readings are “estimated”, as there is no raw data.

From this dataset, I picked the one at the top of the list, (which appears to be totally random), Station number 415429, which is Luling, Texas.

Taking last year as an example, we can see that ten of the twelve months are tagged as “E”, i.e estimated. It is understandable that a station might be a month, or even two, late in reporting, but it is not conceivable that readings from last year are late. (The other two months, Jan/Feb are marked “a”, indicating missing days).

But, the mystery thickens. Each state produces a monthly and annual State Climatological Report, which among other things includes a list of monthly mean temperatures by station. If we look at the 2013 annual report for Texas, we can see these monthly temperatures for Luling.

Where an “M” appears after the temperature, this indicates some days are missing, i.e Jan, Feb, Oct and Nov. (Detailed daily data shows just one missing day’s minimum temperature for each of these months).

Yet, according to the USHCN dataset, all ten months from March to December are “Estimated”. Why, when there is full data available?

But it gets worse. The table below compares the actual station data with what USHCN describe as “the bias-adjusted temperature”. The results are shocking.

In other words, the adjustments have added an astonishing 1.35C to the annual temperature for 2013. Note also that I have included the same figures for 1934, which show that the adjustment has reduced temperatures that year by 0.91C. So, the net effect of the adjustments between 1934 and 2013 has been to add 2.26C of warming.

Note as well, that the largest adjustments are for the estimated months of March – December. This is something that Steve Goddard has been emphasising.

It is plain that these adjustments made are not justifiable in any way. It is also clear that the number of “Estimated” measurements made are not justified either, as the real data is there, present and correct.

Watts appears in the comments, stating that he has contacted John Nielsen-Gammon (Texas State Climatologist) about this issue. Nick Stokes also appears in the comments, and one commenter finds a similar problem for another Texas station.

Homewood’s post sheds light on Goddard’s original claim regarding the data drop out (not just stations that are no longer reporting, but reporting stations that are ‘estimated’). I infer from this that there seems to be a real problem with the USHCN data set, or at least with some of the stations. Maybe it is a tempest in a teacup, but it looks like something that requires NOAA’s attention. As far as I can tell, NOAA has not responded to Goddard’s allegations. Now, with Homewood’s explanation/clarification, NOAA really needs to respond….

(H/T to Climate Realist ~ See WUWT and Hockey Schtick for more)


So we see in the above, that temperatures can be changed years later as the totality of the data is included. What was considered the hottest falls to just an average month in the heat index.

And this has — within the past few months — turned into a very large debate.

EQUIPMENT FAIL II

Here is another example of older/faulty equipment:

A Quick Note about the Difference between RSS and UAH TLT data

There is a noticeable difference between the RSS and UAH lower troposphere temperature anomaly data. Dr. Roy Spencer discussed this in his July 2011 blog post On the Divergence Between the UAH and RSS Global Temperature Records.  In summary, John Christy and Roy Spencer believe the divergence is caused by the use of data from different satellites.  UAH has used the NASA Aqua AMSU satellite in recent years, while as Dr. Spencer writes:

…RSS is still using the old NOAA-15 satellite which has a decaying orbit, to which they are then applying a diurnal cycle drift correction based upon a climate model, which does not quite match reality.

I updated the graphs in Roy Spencer’s post in On the Differences and Similarities between Global Surface Temperature and Lower Troposphere Temperature Anomaly Datasets.

While the two lower troposphere temperature datasets are different in recent years, UAH believes their data are correct, and, likewise, RSS believes their TLT data are correct.  Does the UAH data have a warming bias in recent years or does the RSS data have cooling bias?  Until the two suppliers can account for and agree on the differences, both are available for presentation.


Mark Steyn Goes Online In Front of Congress (+Judith Curry)

This comes by way of WUWT:

  • This is a must watch, share it widely. Mark Steyn demolishes the “science is settled” meme in the Senate hearing yesterday. His ability to argue effectively on the fly is very impressive.

ALSO… 

Hearing: Data or Dogma? Promoting Open Inquiry in the Debate over the Magnitude of Human Impact on Earth’s Climate US Senate Committee on Commerce, Science, and Transportation. Dr. Curry ask to respond to “denier” charge from Sen. Markey, and cites IPCC in her testimony. Steyn spars with Sen. Markey while Markey acts like he’s an authoritarian on the issue.

Is Climate Change Our Biggest Problem? (Bjorn Lomborg)

Is man-made climate change our biggest problem? Are the wildfires, droughts and hurricanes we see on the news an omen of even worse things to come? The United Nations and many political leaders think so and want to spend trillions of tax dollars to reverse the warming trend. Are they right? Will the enormous cost justify the gain? Economist Bjorn Lomborg, director of the Copenhagen Consensus Center, explains the key issues and reaches some sobering conclusions.

Here is a longer talk about “Prioritizing the World: How to spend $75 billion to do the Most Good”

Dr. Bjorn Lomborg is an academic and the author of the best-selling “The Skeptical Environmentalist” and “Cool It”. He challenges mainstream concerns about the environment and points out that we need to focus attention on the smartest solutions first. He is an adjunct professor at the Copenhagen Business School, and director of the Copenhagen Consensus Center, which brings together many of the world’s top economists, including seven Nobel Laureates, to set priorities for the world.

Climate Consensus? No Sir-eee (New Study Shows a Split)

An old Aussie video:

Breitbart adds to the idea of the “Cooked” Cook paper with a real survey:

Nearly six in ten climate scientists don’t adhere to the so-called “consensus” on man-made climate change, a new study by the Dutch government has found. The results contradict the oft-cited claim that there is a 97 percent consensus amongst climate scientists that humans are responsible for global warming.

The study, by the PBL Netherlands Environment Assessment Agency, a government body, invited 6550 scientists working in climate related fields, including climate physics, climate impact, and mitigation, to take part in a survey on their views of climate science.

Of the 1868 who responded, just 43 percent agreed with the IPCC that “It is extremely likely {95%+ certainty} that more than half of [global warming] from 1951 to 2010 was caused by [human activity]”. Even with the “don’t knows” removed that figure increases only to 47 percent, still leaving a majority of climate scientists who do not subscribe to the IPCC’s statement.

The findings directly contradict the claim that 97 percent of climate scientists endorse the view that humans are responsible for global warming, as first made by Cook et al in a paper published in Environment Research Letters.

Cook’s paper has since been extremely widely debunked, yet so ingrained has the 97 percent consensus claim become that The Guardian has an entire section named after it, and President Obama has cited it on Twitter.

Commenting on the new study, Australian climate blogger Joanne Nova said: “Finally there is a decent survey on the topic, and it shows that less than half of what we would call “climate scientists” who research the topic and for the most part, publish in the peer reviewed literature, would agree with the IPCC’s main conclusions. Only 43% of climate scientists agree with the IPCC “97%” certainty.”…

…read it all…

Does ~Nancy “pick-n-choose” Pelosi~ Listen To Herself?

Via Rush:

…Nancy Pelosi reserves for herself and her friends the right to willy-nilly end the life of a God-created human being in the womb. And she argues for that right and protests for that right and demands that right. But when it comes to “destroying the planet,” you better not take one step in that direction. The pope has just said, “We must preserve God’s creation,” quote, Nancy Pelosi: Except where you find it in the womb, apparently. 

[….]

“‘Since everything is interrelated, concern for the protection of nature is also incompatible with the justification of abortion,’ the encyclical says. ‘How can we genuinely teach the importance of concern for other vulnerable beings, however troublesome or inconvenient they may be, if we fail to protect a human embryo, even when its presence is uncomfortable and creates difficulties?'” (Gasp!) Il Papa goes on to say that “population control is not the answer” to climate change.  Fewer people is not the answer. 

Abortion is not permitted. 

Pelosi’s just stepped in it….