First posted in January of 2015
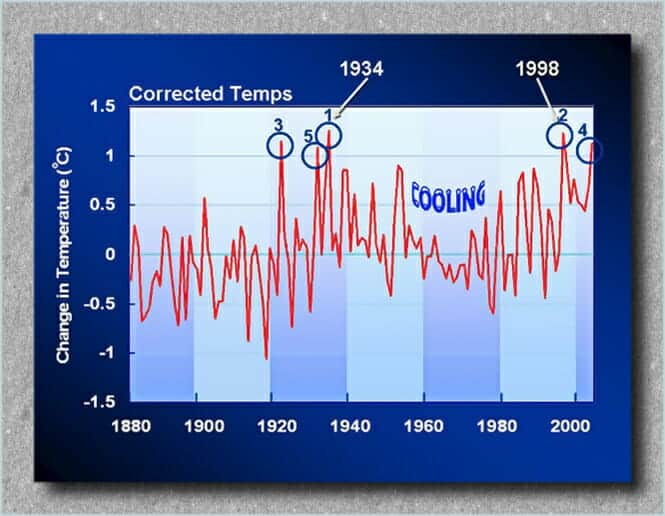
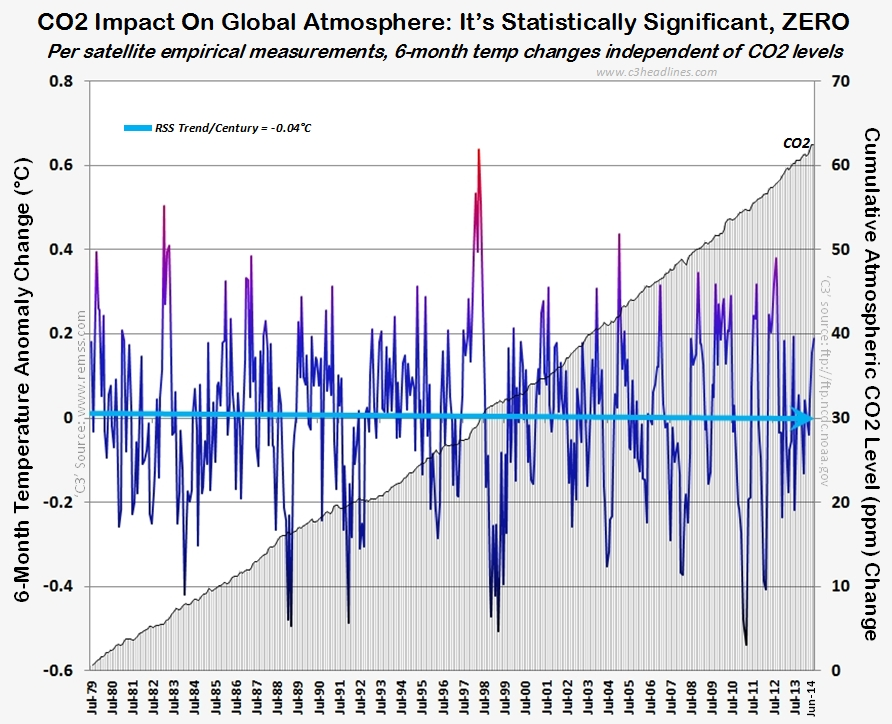
Listen carefully, very carefully. This is [one of] the most important climate change clip you will ever watch – and only 4mins long. Watch and judge yourself. ABSORB the graph shown. THINK on it. USE your brain.
SEE:
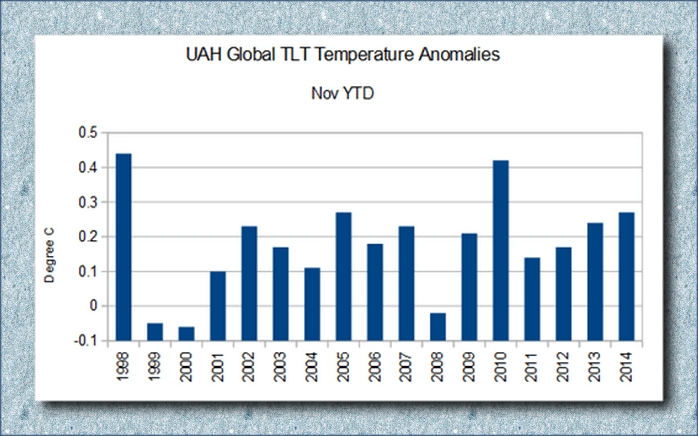
- “For someone to think that 1998 or 2010, or even 2014 are the warmest years… you have to be smoking something.” ~ RPT [Me]
Here are a few evidences — of the many — that indicate it was much warmer in the past and that 2014 wasn’t even near the warmest year [even assuming this to be true!]. The first piece of evidence to show is a recent studies dealing with giant clams.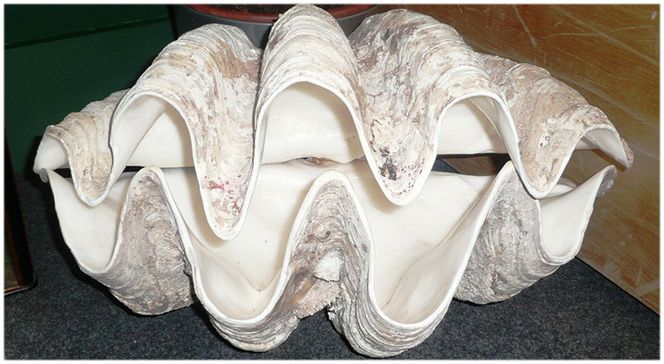
CLAMS
Clams hold pearls and insights to Earth’s climate history. Two recent studies examining clams and coral samples in the South China Sea suggest the climate was warmer during the Medieval period than during modern times.
Two studies out of the Chinese Academy of Sciences found that the climate was warmer in the Roman and Medieval warm periods than today, despite much lower atmospheric concentrations of carbon dioxide.
“This new paper adds further material to the substantial body of real-world proxy evidence establishing that today’s global temperature is within natural ranges of past changes,” Dr. Hong Yan with the Institute of Earth Environment at the Chinese Academy of Sciences.
Studying giant clams and coral reefs, scientists were able to reconstruct sea surface temperature changes going back 2,500 years. What the clam and coral data show is the Roman and Medieval warming periods impacted East Asia and the western Pacific. The study provides further evidence against the theory that there was little global temperature variation until the 20th century.
Both Chinese studies provide evidence for what is called the Medieval Warm Period, which took place during the late Roman Empire and Middle Ages. The period preceded a time of cooling known as the Little Ice Age…..
More from the Chinese Academy of Sciences via Watts Up With That:
Two recent papers, one is in Earth-Science Reviews and the other is in Chinese Science Bulletin, have studied key chemical contents in micro-drilled giant clams shells and coral samples to demonstrate that in the South China Sea the warm period of the Middle Ages was warmer than the present.
The scientists examined surveys of the ratio of strontium to calcium content and heavy oxygen isotopes, both are sensitive recorders of sea surface temperatures past and present. The aragonite bicarbonate of the Tridacna gigas clam-shell is so fine-grained that daily growth-lines are exposed by micro-drilling with an exceptionally fine drill-bit, allowing an exceptionally detailed time-series of sea-temperature changes to be compiled – a feat of detection worthy of Sherlock Holmes himself.
By using overlaps between successive generations of giant clams and corals, the three scientists – Hong Yan of the Institute of Earth Environment, Chinese Academy of Sciences, Willie Soon of the Harvard-Smithsonian Center for Astrophysics and Yuhong Wang of Fudan University, Shanghai – reconstructed a record of sea-surface temperature changes going back 2500 years.
The Roman and Mediaeval Warm Periods both showed up prominently in the western Pacific and East Asia. Sea surface temperatures varied considerably over the 2500-year period.
Changing patterns of winter and summer temperature variation were also detected, disproving the notion that until the warming of the 20th century there had been little change in global temperatures for at least 1000 years, and confirming that – at least in the South China Sea – there is nothing exceptional about today’s temperatures.
Dr. Yan said: “This new paper adds further material to the substantial body of real-world proxy evidence establishing that today’s global temperature is within natural ranges of past changes.” Dr. Soon added: “The UN’s climate panel should never have trusted the claim that the medieval warm period was mainly a European phenomenon. It was clearly warm in South China Sea too.”
(WUWT)
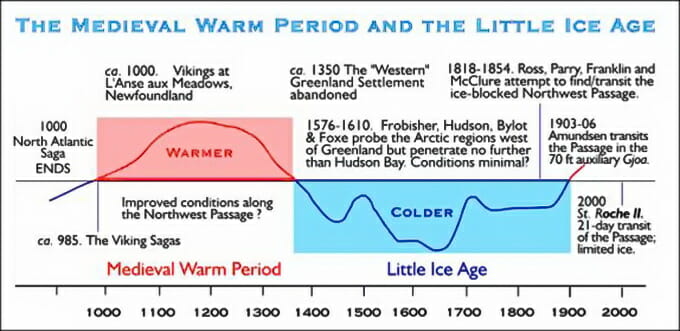
NORTHWEST PASSAGE
Another example is that in the the 1500’s till the late 1800’s passages that are now iced over allowed for what is termed as the Northwest Passage… Exxon or cars weren’t around then?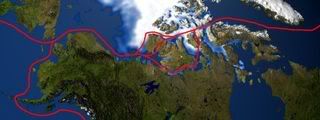
“If you are like me and bit foggy on the Northwest Passage, here is a five cent refresher. The British coined the term Northwest Passage for the potential northern oceanic pass that would allow vessels to move between the Atlantic and Pacific Oceans. The earliest explorations for the fabled passage were by Cortes in 1539. The late 1500’s were marked by British explorers, Martin Frobisher, Humphrey Gilbert, and John Davis. Several expeditions followed, all with little success of finding the passage but tempered by the acquisition of new lands. Some attempts lead to deaths of entire crews. Notable of these is the Sir John Franklin expedition in which all of the crew members were lost to starvation, scurvy, cannibalism, and lead poisoning from food sealed in tins. The first to transverse the Northwest Passage was Sir Robert McClure using a combination of both sledge and ship. Ironically this was done during the search for Franklin’s team in which McClure’s own ship became trapped in the ice for three winters. The passage was finally conquered entirely by sea by the Norwegian Amundsen in 1906.”
UPDATE
New York Times Mentions by Mistake
(WESTERN JOURNAL) The New York Times ran an editorial Saturday about the effect climate change had on discovering the Northwest Passage that appears to contradict claims the Arctic ice is melting at cataclysmic rates.
Global warming would have helped famed fur trader Alexander Mackenzie discover a Northwest Passage connecting North America to China, according to a NYT editorial from author Brian Castner.
His piece contains one significant caveat: Mackenzie’s 1789 trip happened during an era of above normal ice packed in the North that occurred before widespread fossil fuel use.
“Mackenzie paddled during the Little Ice Age, a few centuries of below-normal cold,” Castner wrote before noting Mackenzie’s failed attempt probably would have been successful had temperatures been at normal ranges.
“If he had undertaken his trip during average conditions, or at our current global temperatures, he would not have been stopped by ice,” he added.
“If the ocean hadn’t been icebound, would the fur trade have followed him down the river to China?
Would a summer Deh Cho have been Canada’s own Mississippi River? Would settlers have wagoned in, a northern Oregon Trail?”…
VIKINGS
Another hint are the Vikings and how they flourished.
Here are some great excerpts from a book[s] on the subject that include Icelandic and Greenlandic Vikings:
- The warm climate during the MWP [Medieval Warming Period] allowed this great migration to flourish. Drift ice posed the greatest hazard to sailors but reports of drift ice in old records do not appear until the thirteenth century (Bryson, 1977.)
- The Norse peoples traveled to Iceland for a variety of reasons including a search for more land and resources to satisfy a growing population and to escape raiders and harsh rulers. One force behind the movement to Iceland in the ninth century was the ruthlessness of Harald Fairhair, a Norwegian King (Bryson, 1977.)
- Vikings travelling to Iceland from Norway during the MWP were probably encouraged by the sight of pastures with sedges and grasses and dwarf woodlands of birch and willow resembling those at home.
- Animal bones and other materials collected from archaeological sites reveal Icelandic Vikings had large farmsteads with dairy cattle (a source of meat), pigs, and sheep and goats (for wool, hair, milk, and meat.) Farmsteads also had ample pastures and fields of barley used for the making of beer and these farms were located near bird cliffs (providing meat, eggs, and eiderdown) and inshore fishing grounds. Fishing was primarily done with hand lines or from small boats that did not venture across the horizon (McGovern and Perdikaris, 2000.)
- The Greenland Vikings lived mostly on dairy produce and meat, primarily from cows. The vegetable diet of Greenlanders included berries, edible grasses, and seaweed, but these were inadequate even during the best harvests. During the MWP, Greenland’s climate was so cold that cattle breeding and dairy farming could only be carried on in the sheltered fiords. The growing season in Greenland even then was very short. Frost typically occurred in August and the fiords froze in October. Before the year 1300, ships regularly sailed from Norway and other European countries to Greenland bringing with them timber, iron, corn, salt, and other needed items. Trade was by barter. Greenlanders offered butter, cheese, wool, and their frieze cloths, which were greatly sough after in Europe, as well as white and blue fox furs, polar bear skins, walrus and narwhal tusks, and walrus skins. In fact, two Greenland items in particular were prized by Europeans: white bears and the white falcon. These items were given as royal gifts. For instance, the King of Norway-Denmark sent a number of Greenland falcons as a gift to the King of Portugal, and received in return the gift of a cargo of wine (Stefansson, 1966.) Because of the shortage of adequate vegetables and cereal grains, and a shortage of timber to make ships, the trade link to Iceland and Europe was vital (Hermann, 1954.)
THE SUN
To support the sun being involved, here is another short video:
Another example of this warming comes from the production of wine and the trading boom and crop and animal growth and productivity during this medieval warming period in the Roman Empire. Vineyards on the Salisbury Plains, and other parts on England that wopuld be impossible today:
Farmers and peasants in medieval England launched a thriving wine industry south of Manchester. Good wines demand warm springs free of frosts, substantial summer warmth and sunshine without too much rain, and sunny days in the fall. Winters cannot be too cold — not below zero Fahrenheit for any significant period. The northern limit for grapes during the Middle Ages was about 300 miles above the current commercial wine areas in France and Germany. These wines were not simply marginal supplies, but of sufficient quality and quantity that, after the Norman conquest, the French monarchy tried to prohibit British wine production.
TREES
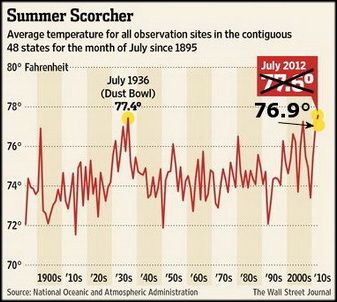
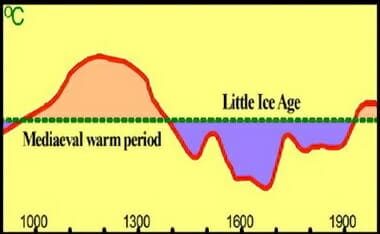
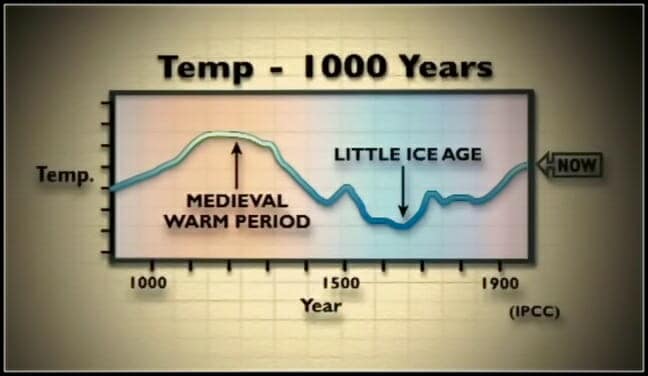
And my final example, one I used in a more layman way with high school students at West Ranch High School was the following. I have wanted to get this copied and up for a long time, and I have the time now. But for the tree lovers, the following will be new information to them surely… and note how the 1990 IPCC graph at the top of this post matches the Chinese one below. This much warmer weather/climate (by three[+] degrees) allowed for higher tree lines in the past:
…3-Degrees Warmer
Tree rings can be counted to date the time of an event, and their summertime width is greater under good growing conditions (warmth, rainfall) than during poor growing seasons (cold, dry). They are limited by the distance back in time researchers can find live trees, dead trees, or buried wood from an earlier time which can be accurately dated to its growth period.
In mountainous northwestern Pakistan, more than 200,000 tree-ring measurements were assembled from 384 long-lived trees that grew on more than twenty individual sites. The 1,300-year temperature proxy shows the warmest decades occurred between 800 and 1000, and the coldest periods between 1500 and 1700.128
Mountain tree line elevations are another sensitive and highly accurate proxy for temperature change. A number of studies of European tree lines testify to the fact that tree lines, farming, and villages moved upslope during the Medieval Warming and back with the Little Ice Age.
A recent study of tree line dynamics in Western Siberia showed that advances in tree lines during the warmer weather of the 20th century were “part of a long-term reforestation of tundra environments.” Two Swiss scientists, Jan Esper and Fritz-Hans Schweingruber, note that “stumps and logs of Larix sibirica can be preserved for hundreds of years” and that “above the tree line in the Polar Urals such relict material from large, upright trees were sampled and dated, confirming the existence, around A.D. 1000, of a forest tree line 30 meters above the late 20th century limit.” They also note, “this previous forest limit receded around 1350, perhaps caused by a general cooling trend.” Thus, the Siberian tree lines testify to the Medieval Warming and the Little Ice Age well outside of Europe.129
Lisa J. Graumlich of Montana State University combined both tree rings and tree lines to assess past climate changes in California’s Sierra Nevada. The trees in the mountains’ upper tree lines are preserved in place, living and dead, for up to 3,000 years. Graumlich says:
A relatively dense forest grew above the current tree line from the beginning of our records to around 100 B.C., and again from A.D. 400 to 1000, when temperatures were warm. Abundance of trees and elevation of tree line declined very rapidly from A.D. 1000 to 1400, the period of severe, multi-decadal droughts. Tree lines declined more slowly from 1500 to 1900 under the cool temperatures of the Little Ice Age, reaching current elevations around 1900.130
Graumlich’s tree evidence confirms both of the last two 1,500-year cycles: the Roman Warming/Dark Ages climate cycle and the Medieval Warming/Little Ice Age. Severe drought, which has been documented in California during the latter part of the Medieval Warming, obscured the timing of the shift from the Medieval Warming to the Little Ice Age. However, both events were clearly evident.
Cave stalagmite cores confirm the global nature of the 1,500-year cycle found in ice cores, seabed sediments, and trees. Their carbon and oxygen isotopes and their trace element content vary with temperature. Moreover, the stalagmites go back further in time than the tree evidence. One German stalagmite goes back more than 17,000 years. Cave stalagmites have been found in Ireland, Germany, Oman, and South Africa whose layers all show the Little Ice Age, the Medieval Warming, the Dark Ages, and the Roman Warming.131 A number of the stalagmites also show the unnamed cold period that preceded the Roman Warming.
In southern Ontario, pollen shows that the warmth-loving beech trees of the Medieval Warming gradually gave way to cold tolerant oaks as the Little Ice Age came on—and then the forest became dominated by pine trees. The oak trees have been making a comeback in Ontario since 1850 and the beech trees can be expected to resurge as the Modern Warming continues in the centuries ahead.132
Remains of prehistoric villages in Argentina were analyzed by Marcela A. Cioccale of the National University of Cordoba to determine where Argentina’s native peoples lived over the past 1,400 years. Using carbon-14 dating, she found that the inhabitants clustered in the lower valleys during the Dark Ages period, and then moved higher up the slopes as the Medieval Warming brought “a marked increase of environmental suitability, under a relatively homogeneous climate.”133 Habitation moved up as high as 4,300 meters in the Central Peruvian Andes around 1000 as the Medieval Warming not only raised temperatures but created more stable conditions for farming. After 1320, people migrated back down the slopes as the colder, less stable climate of the Little Ice Age set in.
Yang Bao of the Chinese Academy of Sciences reconstructed China’s temperature history for the last 2,000 years from ice cores, lake sediments, peat bogs, tree rings, and the historic documents that date back farther in China than in any other country. He found China had its highest temperature during the second and third centuries, toward the end of the Roman Warming. China’s climate was also warm from 800 to 1400, cold from 1400 to 1920, and then began to warm again after 1920.134 (See Figure 4.1.)
Figure 4.1: 2,000 Years of Chinese Temperature History
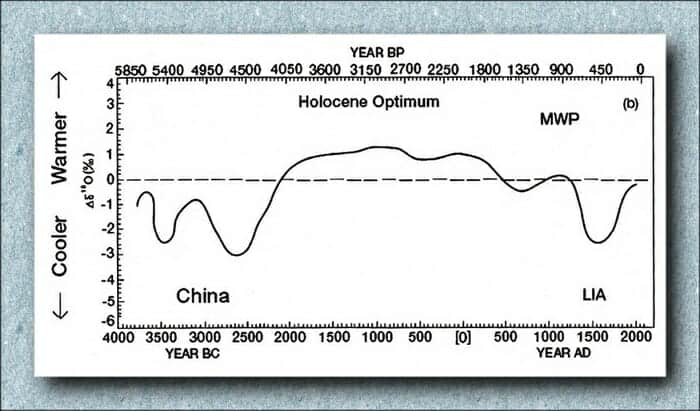
Source [for above figure]: Y. T. Hong et al., “Response of Climate to Solar Forcing Recorded in a 6,000-Year Time-Series of Chinese Peat Cellulose,” The Holocene 10 (2000): 1-7.
[128] J. Esper et al., “1,300 Years of Climate History for Western Central Asia Inferred from Tree Rings,” The Holocene 12 (2002): 267-77.
[129] J. Esper and F. H. Schweingruber, “Large-Scale Tree Line Changes Recorded in Siberia,” Geophysical Research Letters 31 (2004): 10.1029/2003GLO019178.
[130] L. J. Graumlich, “Global Change in Wilderness Areas: Disentangling Natural and Anthropogenic Changes,” U. S. Department of Agriculture Forest Service Proceedings RMRS-P-15-Vol. 3, 2000
[131] F. McDermott et al., “Centennial-Scale Holocene Climate Variability Revealed by a High-Resolution Speleothem 018 Record from SW Ireland,” Science 294 (2001): 1328-331; S. Niggemann et al., “A Paleoclimate Record of the Last 17,600 Years in Stalagmites from the B7 Cave, Sauerland, Germany,” Quaternary Science Reviews 22 (2003): 555-67; U. Neff et. al., “Strong Coherence between Solar Variability and the Monsoon in Oman between 9 and 6 kyr ago,” Nature 411 (2001): 290-93; and Tyson et al., “The Little Ice Age and Medieval Warming in South Africa,” South African Journal of Science 96, no. 3 (2000).
[132] I. D. Campbell and J. H. McAndrews, “Forest Disequilibrium Caused by Rapid Little Ice Age Cooling,” Nature 366 (1993): 336-38
[133] M. A. Cioccale, “Climatic fluctuations in the Central Region of Argentina in the last 1000 years,” Quaternary International 62, (1999): 35-47.
[134] Yang Bao et al., “General Characteristics of Temperature Variation in China during the Last Two Millennia,” Geophysical Research Letters 10 (2002): 1029/2001GLO014485.
- S. Fred Singer and Dennis T. Avery, Unstoppable Global Warming: Every 1,500 Years (Blue Ridge Summit, PA: Rowman & Littlefield, 2007), 63-66.
SOME MORE TREE EVIDENCES:
Greta’s Thunberg’s Northern Sweden Was 3°C Warmer 9300 Years Ago…Trees once grew where tundra is today:
9300-year old vegetation remnants found under receding glaciers in Northern Sweden show that the trees once grew where tundra exists today, meaning it was warmer (NO TRICK ZONE)
A new Swedish publication titled New Presence Of Beaver (Castor fiber L) in the Scandes sustains warmer-than-present conditions and a patchily treed and rich mountainscape finds that trees once grew up to 700 meters above today’s current treeline in Northern Sweden (Lapland, locations 1 and 2).
Over the past 120 years the climate has warmed, and so there’s been glacier and ice patch shrinkage. This has unveiled earlier vegetation and life.
The concerned vegetational remnants that were found represent tree exclaves in ice-empty glacier cirques, the study says.
Found were megafossils of pinus sylvestris with signs of being gnawed by beaver (Castor fiber L.) from different sites in northern Sweden which today are tundra.
They age 9500-9300 cal. yr BP and are located 400-700 m above present-day tree lines.
[….]
These exposed megafossil remnants represent former tree stands that were later on extirpated and entombed by snow and ice for many millennia. At -0.6°C/100 m lapse rate, it means it was then over 3°C warmer than now in this region at a time when atmospheric CO2 concentrations were well below 300 ppm.
For a great interactive map one should see this link embedded in the below graphic, after the excerpt from WUWT. The full (translated to english) study can be found HERE….
MISC. EVIDENCES
The idea of a medieval warm period was formulated for the first time in 1965 by the English climatologist Hubert H. Lamb[1]. Lamb, who founded the UK Climate Research Unit (CRU) in 1971, saw the peak of the warming period from 1000 to 1300, i.e. in the High Middle Ages. He estimated that temperatures then were 1-2 ° C above the normal period of 1931-1960. In the high North, it was even up to 4 degrees warmer. The regular voyages of the Vikings between Iceland and Greenland were rarely hindered by ice, and many burial places of the Vikings in Greenland still lie in the permafrost.
Glaciers were smaller than today
Also the global retreat of glaciers that occurred in the period between about 900 to 1300[2] speaks for the existence of the Medieval Warm Period. An interesting detail is that many glaciers pulling back since 1850 reveal plant remnants from the Middle Ages, which is a clear proof that the extent of the glaciers at that time was lower than today[3].
Furthermore, historical traditions show evidence of unusual warmth at this time. Years around 1180 brought the warmest winter decade ever known. In January 1186/87, the trees were in bloom near Strasbourg. And even earlier you come across a longer heat phase, roughly between 1021 and 1040. The summer of 1130 was so dry that you could wade through the river Rhine. In 1135, the Danube flow was so low that people could cross it on foot. This fact has been exploited to create foundation stones for the bridge in Regensburg this year[4].
Clear evidence of the warm phase of the Middle Ages can also be found in the limits of crop cultivation. The treeline in the Alps climbed to 2000 meters, higher than current levels are[5]. Winery was possible in Germany at the Rhine and Mosel up to 200 meters above the present limits, in Pomerania, East Prussia, England and southern Scotland, and in southern Norway, therefore, much farther north than is the case today[6]. On the basis of pollen record there is evidence that during the Middle Ages, right up to Trondheim in Norway, wheat was grown and until nearly the 70th parallel/latitude barley was cultivated[4]. In many parts of the UK arable land reached heights that were never reached again later.
Also in Asia historical sources report that the margin of cultivation of citrus fruits was never as far north as in the 13th century. Accordingly, it must have been warmer at the time about 1 ° C than today[7].
Archeology and history confirm interglacial
Insects can also be used as historical markers for climate. The cold sensitive beetle Heterogaster urticae was detected during the Roman Optimum and during the Norman High Middle Age in York. Despite the warming of the 20th century, this beetle is found today only in sunny locations in the south of England[8].
During the medieval climate optimum, the population of Europe reached hitherto unknown highs. Many cities were founded at this very time with high-altitude valleys, high pastures and cultivated areas, which were at the beginning of the Little Ice Age again largely abandoned[9].
The Middle Ages was the era of high culture of the Vikings. In this period their expansion occurred into present-day Russia and the settlement of Iceland, Greenland and parts of Canada and Newfoundland. In Greenland even cereals were grown about this time.. With the end of the Medieval Warm Period the heyday of the Vikings ended. The settlements in Greenland had to be abandoned as well as in the home country of Norway, during this time, many northern communities located at higher altitudes[10]. The history of the Vikings also corresponds very well to the temperature reconstructions from Greenland, which were carried out using ice cores. According to the reconstructions, Greenland was at the time of the Vikings at least one degree warmer than in the modern warming period[11].
[1] Hubert H. Lamb, The Early Medieval Warm Epoch and Its Sequel, in Paleogeography, Paleoclimatology, Paleoecology 1 (1965) 13-37
[2] Jean M. Grove, Roy Switsur, Glacial geological evidence for the medieval warm period
[3] Climate News, The Alpine Glacier and the Eisman Ötzi
[4] Wolfgang Behringer, Cultural History of the Climate: From the Ice Age to Global Warming (also Google Books )
[5] Hubert H. Lamb: Climate and Cultural History, Reinbeck 1989
[6] Wilfried Weber, The Development of the Northern Wine Ranges in Europe
[7] De’Er Zhang, Evidence for the existence of the medieval warm period in China
[8] John M. Steane, The Archeology of Medieval England and Wales
[9] Thomas Gale More, Global Warming: A Boon to Human and Other Animals
[10] Willi Dansgard et al., Climatic changes, Norsemen and modern man. Nature 255 24-28
[11] Science Skeptical, Is Greenland Greener? No – colder
INTERACTIVE MAP (linked)
More here: “Medieval Warm Period Project”
UPDATE
This comes by way of WUWT!
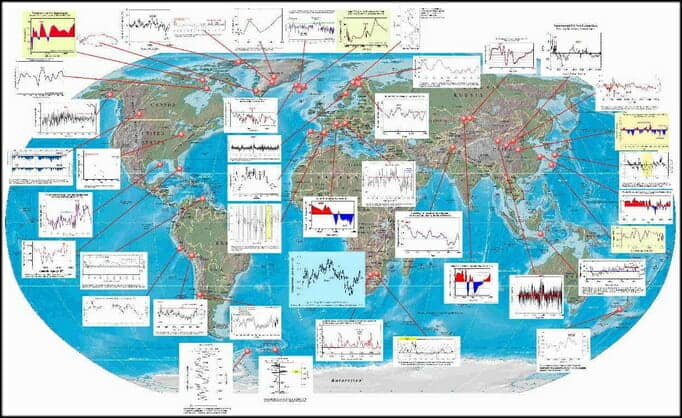
Michael Mann and his team of data manglers like-minded scientists like to tell us the Medieval Warming Period was just a “regional” event rather than global, because if it was global, that destroys their narrative. This new study shows it also occurred in South America, and adds to the growing body of southern hemisphere locations. as we can see in this map below, note the red markers where it was warmer than normal. Sure seems global to me.
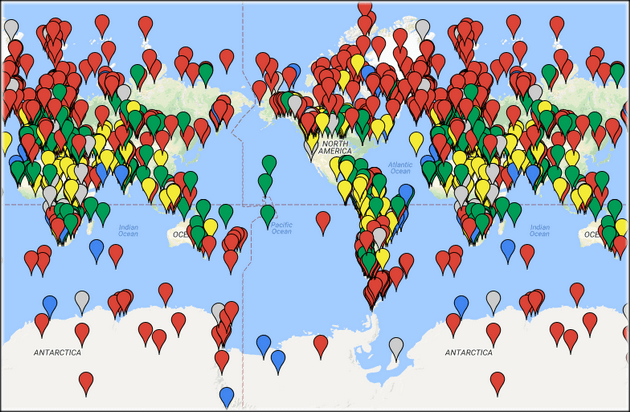
The above UPDATE is really a larger — more in-depth interactive map.