Bible Calls U.S. To Guard Muslims From “Global Warming” ~ Kerry

“…you can see this duty, or responsibility, laid out in scriptures clearly…” (Truth Revolt)

Via One News Now

Already under fire for many of his anti-Christian and pro-Muslim sentiments expressed during his relatively short time in serving under the Obama administration, United States Secretary of State John Kerry made another fairly recent assertion that has many Christians up in arms, as he attempted to interpret Scriptures to say that America is commanded by the Bible to protect the Muslim world from “global warming.”

[….]

America’s chief foreign diplomat contended that both religions scripturally share a common bond to the environment, asserting that because most Muslim countries are “vulnerable” to the effects of “climate change,” the United States is obligated to safeguard them by implementing green policies to protect them from the so-called effects of pollutants.

“Our faiths are inextricably linked on any number of things that we must confront and deal with in policy concepts today,” Kerry proclaimed late last year, according to Freedom Outpost. “Our faiths are inextricably linked on the environment. For many of us, respect for God’s creation also translates into a duty to protect and sustain His first Creation, Earth, the planet.”

Staying true to much of the environmentalist messaging and rhetoric used to promote the green movement’s endorsement of global warming-based policies and industries, Kerry used the Book of Genesis to imply that “Mother Earth” and nature should come before man.

“Before God created man He created Heaven and Earth,” Kerry stressed at the ceremony.

Fighting the greatest threat to humanity?

Kerry argues that fighting the highly contested global warming is perhaps the biggest threat to the world — and he attempted to use the Bible to prove his point, commanding America to use green technology and policies to “aid” Islamic nations.

“Confronting climate change is, in the long run, one of the greatest challenges that we face, and you can see this duty or responsibility laid out in Scriptures, clearly, beginning in Genesis,” Kerry insisted. “And Muslim-majority countries are among the most vulnerable. Our response to this challenge ought to be rooted in a sense of stewardship of Earth. And for me and for many of us here today, that responsibility comes from God.”

Is 2014 The Hottest Year? No (Part 2 of a Series)

This is meant mainly as a supplement to a Christmas Eve-Eve gathering/discussion I was at. I will make this post  a little different than other posts, as, it will be “minimalist.” This is the second installment of the topics covered, which are polar bears, rising sea levels, CO2, Inconvenient Truth (the movie), nuclear power, warmest year, electric vehicles (EVs)/hybrid cars, and bullet trains.

Tarzan couldn’t take this kind of hot!

The question becomes this:

  • WHAT ARE THE DIFFERENT WAYS TO MEASURE TEMPERATURE,
  • WHICH ONE ARE MANY MEDIA SOURCES USING,
  • AND WHICH ARE THE MOST RELIABLE.


These are the questions any serious person who tells people 2014 is the hottest year as if they are the final arbiter of truth. I have dealt with this in the past, but will again deal with it here.

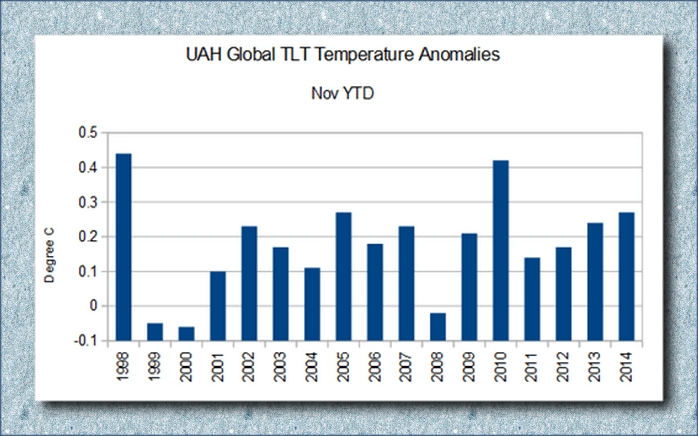
The two main research groups tracking global lower-tropospheric temperatures (our UAH group, and the Remote Sensing Systems [RSS] group) show 2014 lagging significantly behind 2010 and especially 1998:

Viewed another way:

UAH Reading

Another instance highlighting the NOAA’s overestimating temperature is when it said October was the hottest month ever, but RSS data showed October to be ninth warmest on record. And I wonder what family members on the East-Coast would say to there being more than 400 record lows and record cool highs set, via The Weather Channel (11/2014):

A third surge of cold air pushed into the Northern Plains, Upper Midwest and East Coast. This third surge reinforced the cold temperatures for millions of Americans who have already endured at least a week of January-like chill.

There have been more than 400 record lows and record cool highs set, covering 43 states, since Sunday. That leaves only five states in the contiguous U.S., all in New England, that have not experienced record cold temperatures this week. 

On Wednesday morning record lows were broken or tied from New York to Houston. Thursday morning brought more record cold to parts of the Southeast.

[….]

First arctic surge: Spread into the East last week (November 11-15).

– Second arctic surge: Blasted through the East, Midwest, and South through early Thursday (November 16-20). For parts of the mid-Mississippi Valley, Ohio Valley, Tennessee Valley and the Middle Atlantic States, this was the coldest of the surges, with numerous daily record lows broken.

– Third arctic surge: Reached the Northern Plains and Upper Midwest Thursday, then slid east across the Great Lakes and parts of the Northeast on Friday. It did not press nearly as far south as the first and second surges did.

– Cold relief: Relief began in the Rockies, then expanded into the southern Plains and Southeast Wednesday and Thursday. Midwest and Northeast relief arrives this weekend.

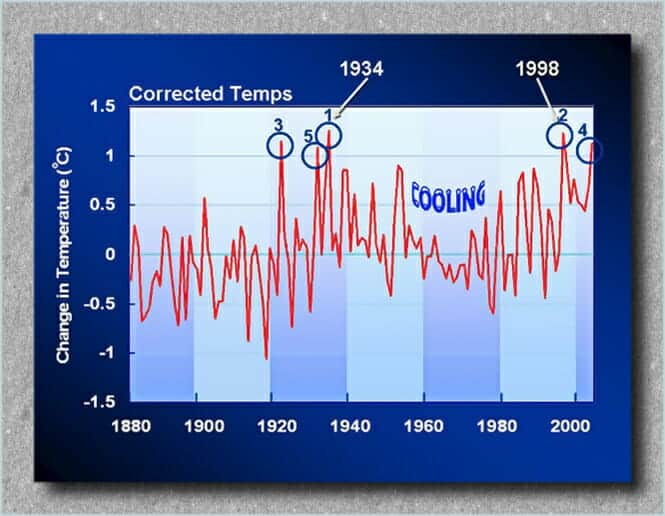
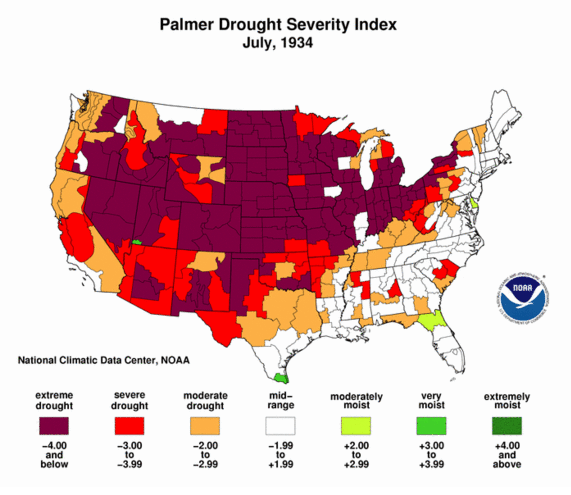
Okay, what we have already seen is that the satellite temperatures say 2014 will NOT BE the hottest year. One should ask what the hottest year was: 1934:

2CorrectedTemps_lg

(L.A. Times) A slight adjustment to U.S. temperature records has bumped 1998 as the hottest year in the country’s history and made the Dust Bowl year of 1934 the new record holder, according to NASA.

[….]

That meant that 1998, which had been 0.02 degrees warmer than 1934, was now 0.04 degrees cooler.

This is where I transition to the NOAA temperature, but I wanted to take this transition with help from Dr. Willie Soon (NM), who is an Astrophysicist and Geoscientist at the Solar and Stellar Physics (SSP) Division, Harvard-Smithsonian Center for Astrophysics. (I will embolden the point made below.) More and more scientists have been coming out of the closet and Dr. Soon is one of them. He says in fact that if his community continues “to keep silent and do not express outrage like the one I now feel, the notion of science as a philosophy and way of life will soon be reduced to computer games and animation for the mind-controllers and beauty-contest institutions….” Dr. Soon continues:

2014 hottest year a manipulation

Is this a joke or simply my BAD dream? Prostituting science like this is now consider a virtue. It is no wonder that science writer Lord Ridley said that he has lost his faith on science as an institution.

Why would anyone even bother with claims and insistence of the globe in 2014 being the hottest to a relative colder years all within a few hundredths of a degree Celsius? Poor Anders Celsius should be dancing in his grave.

The claim is based on just one (from a half dozen or so) thermometer-based products whose measurement quality is fraught with uncertainty and with actual error bars at least ten times larger than those claimed “effects”. WMO and others simply pick and choose the “data” that produces the press news they want in time for the Lima, Peru political pow-wow.

In truth the datasets taken as a whole clearly show that the global temperature has been flat-trending for nearly two decades now and that the theory of rising CO2 leading to global warming is sorrowfully exaggerated.

This kind of manipulative science, exemplified by IPCC, WMO, NOAA and what have you, is serving its master in the realm of politics and policy, and is indeed very sickening.

All of them are essentially behaving in ways we would never want any of our school children to behave: cheating and manipulating that are accompanied by careful wording and clever rhetoric….

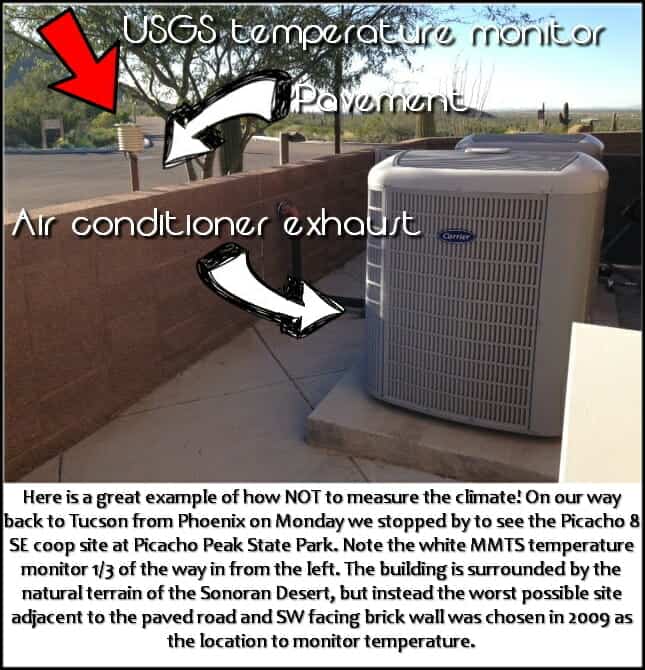
This sets us up for HOW the NOAA gets their temperatures, and why they are inaccurate. The below is posted elsewhere on my blog and is semi-technical for the layman. But the key is PLACEMENT, and you can see that in the photo’s below Dr. Mueller’s presentation on how the numbers are skewed/manipulated.

(Dr. Mueller is part of the Department of Physics at the University of California at Berkeley, and Faculty Senior Scientist at the Lawrence Berkeley Laboratory, where he is also associated with the Institute for Nuclear and Particle Astrophysics.)


ESPIONAGE

There seems to be a misunderstanding by the general public of the NOAA and other organizations and how they misuse data points (or average them wrongly).

So, for instance, professor Mueller at Berkeley mentions how climate “scientists” were hiding the decline in the past:

They were skewing the numbers in other words. This is an example of fraud. But numbers can be skewed by faulty or outdated methods/equipment. For instance,


EQUIPMENT FAIL

Here is a recent mention of the below in COMMENTARY MAGAZINE (added here 9-4-19):

STUDY by meteorologist Anthony Watts found that almost 90 percent of the 1221 weather stations in the U.S. did not meet the National Weather Service’s setting standards, which requires that they be at least 100 feet from any artificial heat source or radiating surface. You can see some of the most egregious violators here. To deal with this defective information, climate scientists, have “adjusted” the data to solve this problem. Invariably, these adjustments have made earlier data show lower temperatures, and recent data show higher ones.

To develop reliable data, the National Oceanic and Atmospheric Administration (NOAA) placed 114 state-of-the-art weather stations relatively evenly spaced about the lower 48 states. They were carefully sited to be away from urban areas, which are heat islands, airports, which can be affected by jet exhaust, etc.

The system became operative in 2005. Now, realclearenergy.com is reporting that there has been no increase in average temperatures in the continental United States over the last 14 years, as measured by these new stations. If anything, overall temperatures are slightly cooler than they were….

Here are some examples of fudged data because of sub-standard equipment:

You’d think the answer would be obvious, but here we have a NOAA operated USHCN climate station of record providing a live experiment. It always helps to illustrate with photos. Today I surveyed a sewage treatment plant, one of 4 stations surveyed today (though I tried for 5) and found that for convenience, they had made a nice concrete walkway to allow servicing the Fisher-Porter rain gauge, which needs a paper punch tape replaced one a month.

Here is what you see in visible light:

Here is what the infrared camera sees:

Note that the concrete surface is around 22-24°C, while the grassy areas are between 12-19°C

This station will be rated a CRN5 by this definition from the NOAA Climate Reference Network handbook, section 2.2.1:

Class 5 (error >~= 5C) – Temperature sensor located next to/above an artificial heating source, such a building, roof top, parking lot, or concrete surface.”

More than half of the stations the NOAA use are tainted or wrongly placed equipment.


CHANGING DATA-SETS

Another example of changing averages was noted by Steve Goddard and others — even the NOAA have acknowledge it — have been discussing recently is exemplified in Dr. Judith Carry’s post on the matter (from a larger post of mine):


Even the Wall Street Journal chose the higher temperature reading to say that July of 2012 was July was the “hottest month in the contiguous U.S. since records began in 1895.” WUWT found this on accident and it has led to quite a few other revelations as we will see. Here is description in part of what we looking at:

Glaring inconsistencies found between State of the Climate (SOTC) reports sent to the press and public and the “official” climate database record for the United States. Using NCDC’s own data, July 2012 can no longer be claimed to be the “hottest month on record”.

[….]

I initially thought this was just some simple arithmetic error or reporting error, a one-off event, but then I began to find it in other months when I compared the output from the NCDC climate database plotter. Here is a table of the differences I found for the last two years between claims made in the SOTC report and the NCDC database output.

[….]

In almost every instance dating back to the inception of the CONUS Tavg value being reported in the SOTC report, there’s a difference. Some are quite significant. In most cases, the database value is cooler than the claim made in the SOTC report. Clearly, it is a systemic issue that spans over two years of reporting to the press and to the public.

It suggests that claims made by NCDC when they send out these SOTC reports aren’t credible because there are such differences between the data. Clearly, NCDC means for the plotter output they link to, to be an official representation to the public, so there cannot be a claim of me using some “not fit for purpose” method to get that data….

The WALL STREET JOURNAL made a graph showing this record setting month (below-left). The more accurate temperature for July likewise is shown in the same graph (below-right):

This looking at the data sets chosen and what is used and isn’t used to support an idea that fails in every way. Combine this obvious cherry-picking with the bias, collusion, and charges against the report that the President used to route Congress, all show we have a problem Houston! But this is only the tip of the proverbial iceberg. It seems the NOAA has been skewing these temps for some time. Why? Because the left uses this as a way to promote an ever growing government and the scientists get more-and-more funding. This data fudging story is newer, and it is evolving quickley, including this newest post via Real Science where Steve Goddard notes that More Than 40% Of USHCN Station Data Is Fabricated. Here is Dr. Judith carry’s synopsis (excerpted), in which she critiques a bit Goddard’s post… but then bows to the evidence:

OK, acknowledging that Goddard made some analysis errors, I am still left with some uneasiness about the actual data, and why it keeps changing. For example, Jennifer Marohasy has been writing about Corrupting Australian’s temperature record.

In the midst of preparing this blog post, I received an email from Anthony Watts, suggesting that I hold off on my post since there is some breaking news. Watts pointed me to a post by Paul Homewood entitled Massive Temperature Adjustments At Luling, Texas. Excerpt:

So, I thought it might be worth looking in more detail at a few stations, to see what is going on. In Steve’s post, mentioned above, he links to the USHCN Final dataset for monthly temperatures, making the point that approx 40% of these monthly readings are “estimated”, as there is no raw data.

From this dataset, I picked the one at the top of the list, (which appears to be totally random), Station number 415429, which is Luling, Texas.

Taking last year as an example, we can see that ten of the twelve months are tagged as “E”, i.e estimated. It is understandable that a station might be a month, or even two, late in reporting, but it is not conceivable that readings from last year are late. (The other two months, Jan/Feb are marked “a”, indicating missing days).

But, the mystery thickens. Each state produces a monthly and annual State Climatological Report, which among other things includes a list of monthly mean temperatures by station. If we look at the 2013 annual report for Texas, we can see these monthly temperatures for Luling.

Where an “M” appears after the temperature, this indicates some days are missing, i.e Jan, Feb, Oct and Nov. (Detailed daily data shows just one missing day’s minimum temperature for each of these months).

Yet, according to the USHCN dataset, all ten months from March to December are “Estimated”. Why, when there is full data available?

But it gets worse. The table below compares the actual station data with what USHCN describe as “the bias-adjusted temperature”. The results are shocking.

In other words, the adjustments have added an astonishing 1.35C to the annual temperature for 2013. Note also that I have included the same figures for 1934, which show that the adjustment has reduced temperatures that year by 0.91C. So, the net effect of the adjustments between 1934 and 2013 has been to add 2.26C of warming.

Note as well, that the largest adjustments are for the estimated months of March – December. This is something that Steve Goddard has been emphasising.

It is plain that these adjustments made are not justifiable in any way. It is also clear that the number of “Estimated” measurements made are not justified either, as the real data is there, present and correct.

Watts appears in the comments, stating that he has contacted John Nielsen-Gammon (Texas State Climatologist) about this issue. Nick Stokes also appears in the comments, and one commenter finds a similar problem for another Texas station.

Homewood’s post sheds light on Goddard’s original claim regarding the data drop out (not just stations that are no longer reporting, but reporting stations that are ‘estimated’). I infer from this that there seems to be a real problem with the USHCN data set, or at least with some of the stations. Maybe it is a tempest in a teacup, but it looks like something that requires NOAA’s attention. As far as I can tell, NOAA has not responded to Goddard’s allegations. Now, with Homewood’s explanation/clarification, NOAA really needs to respond….

(H/T to Climate Realist ~ See WUWT and Hockey Schtick for more)


So we see in the above, that temperatures can be changed years later as the totality of the data is included. What was considered the hottest falls to just an average month in the heat index.

And this has — within the past few months — turned into a very large debate.


EQUIPMENT FAIL II

Here is another example of older/faulty equipment:

A Quick Note about the Difference between RSS and UAH TLT data

There is a noticeable difference between the RSS and UAH lower troposphere temperature anomaly data. Dr. Roy Spencer discussed this in his July 2011 blog post On the Divergence Between the UAH and RSS Global Temperature Records.  In summary, John Christy and Roy Spencer believe the divergence is caused by the use of data from different satellites.  UAH has used the NASA Aqua AMSU satellite in recent years, while as Dr. Spencer writes:

RSS is still using the old NOAA-15 satellite which has a decaying orbit, to which they are then applying a diurnal cycle drift correction based upon a climate model, which does not quite match reality.

I updated the graphs in Roy Spencer’s post in On the Differences and Similarities between Global Surface Temperature and Lower Troposphere Temperature Anomaly Datasets.

While the two lower troposphere temperature datasets are different in recent years, UAH believes their data are correct, and, likewise, RSS believes their TLT data are correct.  Does the UAH data have a warming bias in recent years or does the RSS data have cooling bias?  Until the two suppliers can account for and agree on the differences, both are available for presentation.


ROSE COLORED GLASSES

Another example of competing ideas is this example from two major UK papers, the first being from the Guardian:

This next one from the Daily Mail:

(DAILY MAIL) ….The most widely used measurements of Arctic ice extent are the daily satellite readings issued by the US National Snow and Ice Data Center, which is co-funded by Nasa. These reveal that – while the long-term trend still shows a decline – last Monday, August 25, the area of the Arctic Ocean with at least 15 per cent ice cover was 5.62 million square kilometres.

This was the highest level recorded on that date since 2006 (see graph, right), and represents an increase of 1.71 million square kilometres over the past two years – an impressive 43 per cent.

Other figures from the Danish Meteorological Institute suggest that the growth has been even more dramatic. Using a different measure, the area with at least 30 per cent ice cover, these reveal a 63 per cent rise – from 2.7 million to 4.4 million square kilometres.

[….]

Crucially, the ice is also thicker, and therefore more resilient to future melting. Professor Andrew Shepherd, of Leeds University, an expert in climate satellite monitoring, said yesterday: ‘It is clear from the measurements we have collected that the Arctic sea ice has experienced a significant recovery in thickness over the past year.

‘It seems that an unusually cool summer in 2013 allowed more ice to survive through to last winter. This means that the Arctic sea ice pack is thicker and stronger than usual, and this should be taken into account when making predictions of its future extent.’

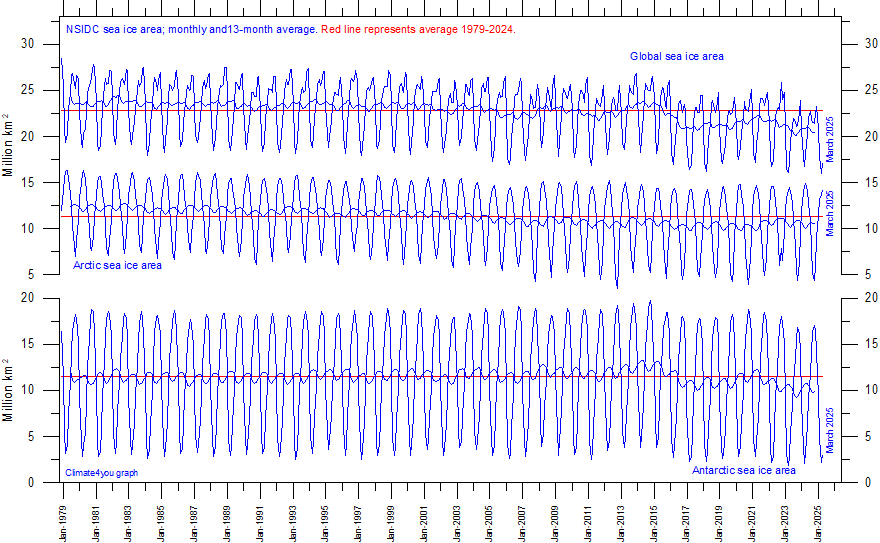
Same data used, one says BEWARE, the END IS NEAR, the other says making gains, as the graph shows below:

(So are Polar Bears, BTW) And the Antarctic has made BIG GAINS. But if the left — yes, the left — says we should renter the little ice-age to be at a normal point of “climate disruption,” then they are living a pipe-dream. As the earth gets warmer life flourishes, as warmer periods in history have exemplified:

June was ranked one of the coldest months in a while. According to the NOAA, July 2014 ranked 29th coldest out of 120 using the Maximum temperature. And so we enter the discussion about if the pause is real… which is now being acknowledged by almost all (except the IPCC).


PAUSE

Here is Dr. Judith Curry posting ion the subject before getting into two papers that talk about it from two points of view:

With 39 explanations and counting, and some climate scientists now arguing that it might last yet another decade, the IPCC has sidelined itself in irrelevance until it has something serious to say about the pause and has reflected on whether its alarmism is justified, given its reliance on computer models that predicted temperature rises that have not occurred. – Rupert Darwall 

The statement by Rupert Darwall concisely states what is at stake with regards to the ‘pause.’   This seriously needs to be sorted out….

For a running — updated — list of these excuses mentioned above, see here. What HAS been clearly shown is that while some wish to make CO2 illegal, CO2 is in fact not driving the climate:


GROUP-THINK

What is being shown as of late is that more-and-more scientists are becoming concerned with the group-think in the climate-sciences. Again, Dr. Judith Curry was the biggest pro-AGW proponent, but has — like many others leaders in their respective field — changed or softened her/their positions on what the science is actually showing:

The implications of dogmatic groupthink and intimidation for the pursuit of sound science — and sound policy — are chilling. – Christopher Snowden

A collection of articles from the health science community on the fate of papers and scientists that challenge the consensus.


SUN & OCEAN

  • Gross Scientific Negligence – IPCC Ignored Huge Body Of Peer-Reviewed Literature Showing Sun’s Clear Impact – See more at: http://tinyurl.com/kw47zcf (NASA is changing on this as well)
  • NASA is saying the sun — thanks to the Goddard Institute studying this, is the driver of warming and cooling: http://tinyurl.com/m29yo99 (Via Hockey Shtick)

And yet another study is showing the sun as the major player… NOT greenhouse gases.

So what’s the bottom line? NOAA temps change over time. Many in this respective field are seeing group-think. Ideology is driving this group-think, not science.

Why should you be interested? Sea surface temperature records indicate El Niño and La Niña events are responsible for the warming of global sea surface temperature anomalies over the past 30 years, not man-made greenhouse gases. I’ve searched sea surface temperature records for more than 4 years and ocean heat content records for more than 3 years, and I can find no evidence of an anthropogenic greenhouse gas signal in either dataset. That is, the warming of the global oceans has been caused by naturally occurring, sunlight-fueled, coupled ocean-atmosphere processes, not anthropogenic greenhouse gases.

(From the newest global temp data-set at WUWT)

No matter what evidences one puts forward, until people remove their rose-colored glasses, they will continue to explain away the pause showing CO2 has nothing to do with global temperatures.

The Race-Card Extends To Global Warming Skepticism

Former vice president Al Gore compared climate skeptics to apologists for old-time Bull Connor-style racism and urges that the appropriate response, in order to “win the conversation” on climate change, is to shame and shun them.

When losing an argument… pull your “race-card”

The Daily Caller notes:

The former vice president [in an interview] recalled how society succeeded in marginalizing racists and said climate change skeptics must be defeated in the same manner.

“Secondly, back to this phrase ‘win the conversation,'” he continued. “There came a time when friends or people you work with or people you were in clubs with — you’re much younger than me so you didn’t have to go through this personally — but there came a time when racist comments would come up in the course of the conversation and in years past they were just natural. Then there came a time when people would say, ‘Hey, man why do you talk that way, I mean that is wrong. I don’t go for that so don’t talk that way around me. I just don’t believe that.’ That happened in millions of conversations and slowly the conversation was won.”

Hmm, “winning a conversation” with science skeptics by treating them as miscreants, caught in the act of justifying “gross and evil” attitudes. Where have we heard this strategy before? Ah yes….

(Evolution News & Views)

When university professors teach that race, class, gender (the liberal/progressive “Trinity”) is the lens to look through at history, socio-economics, horticulture, climate, and the like… are you really surprised about the following?

Claim: Global warming skepticism is a ‘white phenomenon’’

….Hispanics (41 percent) and African-Americans (36 percent) were both twice as likely to reply that climate change will harm them directly; 18 percent of white Americans predicted climate repercussions will hurt them personally.

Within religious groups, members of three Caucasian religious sects — out of the eight religious affiliations the survey analyzed — were the least likely to be highly or somewhat concerned about climatic changes. And those who identified as white evangelical Christians were the least likely to worry about climate change: 64 percent were either “somewhat” or “very” unconcerned, and 18 percent were “very” concerned.

Jewish Americans (66 percent), Hispanic Catholics (61 percent) and black Protestants (50 percent) said they believe in climate change, as did 57 percent of Americans without religious ties. Ï Regarding the construction of the Keystone XL pipeline, those surveyed were about as divided as Congress: 52 percent said they supported the project, and 37 opposed it. Nearly 6 out of 10 (57 percent), however, favored measures that limit carbon dioxide emissions from power plants even if the policies ramped up prices.

Self-identified members of the tea party were highly unlikely to believe in climate change (23 percent), and a majority (53 percent) were skeptics. Roughly two-thirds of Democrats said they believe in climate change, and 22 percent of Republicans said they are climate believers, while 46 percent said they are skeptical.

“More than three-quarters of climate change skeptics are white. So it’s really a white phenomenon,” Cox said. “We found a pretty significant racial divide.”

Related links via Climate Depot:

  • Climate Activists: ‘White America’ condemned to Hell!? — Warmist Bill McKibben laments ‘White America’ has failed: ‘White America has fallen short’ by voting for ‘climate deniers’
  • Flashback: 1846, in Australia, Aborigines blamed the bad climate on the introduction of the White man in Australia

Polluting the Beauty and Cleanliness Of Our World With Renewable Energy

Can you imagine the polluted, destroyed world we would have if the left had their way with green energy?

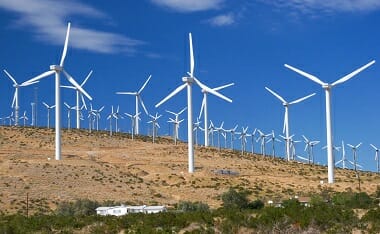
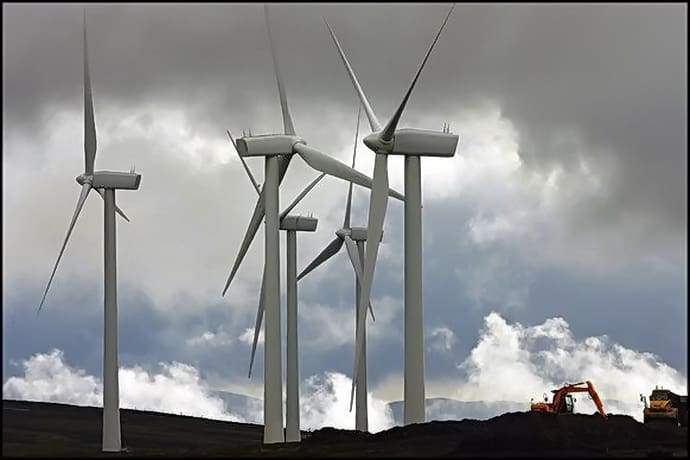
Environazis, like all progressives, care about two things: other people’s money and the power entailed in imposing their ideology. Prominent among the many things they do not care about is the environment, as demonstrated by a monstrosity planned for Loch Ness:

A giant 67 turbine wind farm planned for the mountains overlooking Loch Ness will be an environmental disaster thanks to the sheer quantity of stone which will need to be quarried to construct it, according to the John Muir Trust. In addition, the Trust has warned that the turbines spell ecological disaster for the wet blanket peat-land which covers the area and acts as a huge carbon sink, the Sunday Times has reported.

According to global warming dogma, carbon sinks are crucial in preventing human activity from causing climatic doom.

The planet isn’t the only victim of this ideologically driven enterprise:

Around one million people visit the picturesque Loch Ness, nestled in the highlands of Scotland each year, bringing about £25 million in revenue with them. Most are on the lookout for the infamous monster, but if Scottish and Southern Energy (SSE) get their way the tourists will have something else to look at: the Stronelairg wind farm – 67 turbines, each 443ft high, peppered across the Monadhlaith mountains overlooking the Loch.

….read it all….

Remember what the two top Google scientist in charge of their renewable energy program just said?

We came to the conclusion that even if Google and others had led the way toward a wholesale adoption of renewable energy, that switch would not have resulted in significant reductions of carbon dioxide emissions. Trying to combat climate change exclusively with today’s renewable energy technologies simply won’t work; we need a fundamentally different approach.

[…..]

“Even if one were to electrify all of transport, industry, heating and so on, so much renewable generation and balancing/storage equipment would be needed to power it that astronomical new requirements for steel, concrete, copper, glass, carbon fibre, neodymium, shipping and haulage etc etc would appear. All these things are made using mammoth amounts of energy: far from achieving massive energy savings, which most plans for a renewables future rely on implicitly, we would wind up needing far more energy, which would mean even more vast renewables farms – and even more materials and energy to make and maintain them and so on. The scale of the building would be like nothing ever attempted by the human race.”

But asking someone who has swallowed this story is like beating a dead horse. They will tell me — to my face — that mankind releasing CO2 into the atmosphere is driving weather changes.

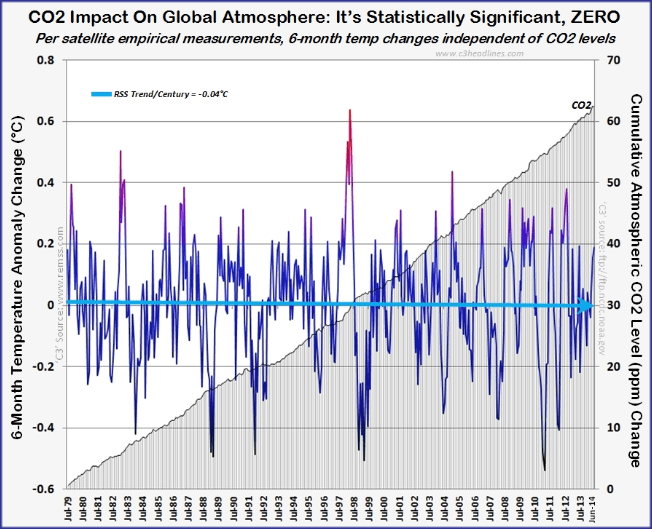
I will point out a graph that shows in the past couple of decades man has produced more CO2 combined from the previous 100-years, overlayed to the temperature staying the same for over 18-years (in fact, falling a bit since 2005), and this MAJOR, FOUNDATIONAL belief being shown false doesn’t sway their “belief” towards rethinking their previously held paradigm.

Google Joins the Common Sense Crew On Renewable Energies ~ Finally!

Google Dirt

“At the start of RE<C, we had shared the attitude of many stalwart environmentalists: We felt that with steady improvements to today’s renewable energy technologies, our society could stave off catastrophic climate change. We now know that to be a false hope… Renewable energy technologies simply won’t work; we need a fundamentally different approach.” (Spectrum, via What’s Up With That)

Via Breitbart, useless venture.

Some people call it “renewable energy” but I prefer to call it “alternative energy” because that’s what it really is: an alternativeto energy that actually works (eg nuclear and anything made from wonderful, energy-rich fossil fuel.)

Now a pair of top boffins from uber-green Google’s research department have reached the same conclusion.

Ross Konigstein and David Fork, both Stanford PhDs (aerospace engineering; applied physics) were employed on a Google research project which sought to enhance renewable technology to the point where it could produce energy more cheaply than coal. But after four years, the project was closed down. In this post at IEEE Spectrum they tell us why.

We came to the conclusion that even if Google and others had led the way toward a wholesale adoption of renewable energy, that switch would not have resulted in significant reductions of carbon dioxide emissions. Trying to combat climate change exclusively with today’s renewable energy technologies simply won’t work; we need a fundamentally different approach.

Why is renewable energy such a total fail? Because, as Lewis Page explains here, it’s so ludicrously inefficient and impossibly expensive that if ever we were so foolish as to try rolling it out on a scale beyond its current boutique levels, it would necessitate bankrupting the global economy….

…read more…

Lets apply to this issue the three magic questions that are never asked by the left:

1) compared to what?
2) at what cost?
3) what hard-evidence do you have?

Now, let’s apply this to the newer power plant in the Mojave desert and see if these questions were asked beforehand?

….A solar power plant in the Mojave Desert that’s attracted negative attention for its injuries to birds is producing a whole lot less power than it’s supposed to, according to Energy Department figures.ivanpah-solar-10-30-14-thumb-600x400-83195

According to stats from the U.S. Energy Information Administration, a number-crunching branch of the U.S. Department of Energy, the Ivanpah Solar Electric Generating System in San Bernardino County has produced only about a quarter of the power it’s supposed to, with both less than optimal weather and apparent mechanical issues contributing to the shortfall.

[….]

As Danko points out, Ivanpah’s owners have recently sought extensions on the repayment schedule for the $1.6 billion in government-backed loans that paid for Ivanpah’s construction, hoping to delay writing checks until the firms can secure a government grant they hope to use to pay down the loan….

(KCET)

Solar

So it seems that these more left leaning environmentalists think it is okay to spend billions of tax-payer money and regulate businesses on ideas that do not work anywhere but in Utopian dreams. Let’s end with WUWT quoting these Google Ph.D.s and then segway out with commentary:

“Even if one were to electrify all of transport, industry, heating and so on, so much renewable generation and balancing/storage equipment would be needed to power it that astronomical new requirements for steel, concrete, copper, glass, carbon fibre, neodymium, shipping and haulage etc etc would appear. All these things are made using mammoth amounts of energy: far from achieving massive energy savings, which most plans for a renewables future rely on implicitly, we would wind up needing far more energy, which would mean even more vast renewables farms – and even more materials and energy to make and maintain them and so on. The scale of the building would be like nothing ever attempted by the human race.”

I must say I’m personally surprised at the conclusion of this study. I genuinely thought that we were maybe a few solar innovations and battery technology breakthroughs away from truly viable solar power. But if this study is to be believed, solar and other renewables will never in the foreseeable future deliver meaningful amounts of energy.

Apple as well is struggling with it’s Utopian — only works on paper — dreams.Solar Apple

Powerline notes that “yesterday’s Wall Street Journal story about the production difficulties of the Arizona supplier that Apple selected to make sapphire screens for the iPhone 6 was fascinating in its own right, but there was one little detail in the story that zipped by too quickly.” Continuing they quote the WSJ:

Mr. Squiller, the GT operations chief, told the bankruptcy court that GT lost three months of production to power outages and delays building the facility.

Whoa, show down there a moment: what’s this about power outages? I’d sure like to know more of the full story here. Was this simply bad engineering on site, or was there a problem with the local grid or the energy sources supplying the grid in that area? Grid stability is going to be a more serious issue going forward as we compel more and more “renewable” (meaning “less stable”) energy as part of the EPA’s mania to restructure the electricity sector through the Clean Air Act.


Why Clouds Matter! CERN’s C.L.O.U.D. Program Drives Real Climate Science

(The above graph is an example of how cosmic rays affect the cloud cover of earth… of which will be explained somewhat in what follows.) This post is partly to explain what CERN (CLOUD) is and to point out that global warming and cooling is based on something other than man. (For a semi-technical philosophical/theological walk through CERN’s discovery of the “God Particle,” see Dr. William Lane Craig’s review.) In other words, driven mainly by nature… not man. First, let us get a primer on why clouds play an important role in climate sensitivity in an interview of Dr. Roy Spencer:

Clouds the Key to Global Warming from Papa Giorgio on Vimeo.

Dennis Prager Interviews Climatologist, Roy W. Spencer:

Roy W. Spencer is a climatologist and a Principal Research Scientist for the University of Alabama in Huntsville, as well as the U.S. Science Team Leader for the Advanced Microwave Scanning Radiometer (AMSR-E) on NASA’s Aqua satellite. He has served as senior scientist for climate studies at NASA’s Marshall Space Flight Center in Huntsville, Alabama.

He is known for his satellite-based temperature monitoring work, for which he was awarded the American Meteorological Society’s Special Award. Spencer’s research suggests that global warming is mostly natural, and that the climate system is quite insensitive to humanity’s greenhouse gas emissions and aerosol pollution and suggests that natural, chaotic variations in low cloud cover may account for most observed warming.

(WIKI)

For more clear thinking like this from Dennis Prager… I invite you to join Pragertopia.

Here is CERN’s recent discoveries discussed on a Canadian Broadcast to better introduce the video by CERN that follows:

Here is a short blurb by What’s Up With That to help introduce the topic:

This refers to the CLOUD experiment at CERN.

I’ll have more on this as it develops (updated twice since the original report now), but for the short term, it appears that a non-visible light irradiance effect on Earth’s cloud seeds has been confirmed. The way it is posited to work is that the  effect of cosmic rays (modulated by the sun’s magnetic variations which either allow more or deflect more cosmic rays) creates cloud condensation nuclei in the Earth’s atmosphere. With more condensation nuclei, more clouds form and vice-versa. Clouds have significant effects on TSI at the surface.

“Cloud feedbacks are the primary source of inter-model differences in equilibrium climate sensitivity, with low cloud being the largest contributor”.Even the IPCC has admitted this in their latest (2007) report:

Update: From the Nature article, Kirkby is a bit more muted in his assessment than the GWPF:

Early results seem to indicate that cosmic rays do cause a change. The high-energy protons seemed to enhance the production of nanometre-sized particles from the gaseous atmosphere by more than a factor of ten. But, Kirkby adds, those particles are far too small to serve as seeds for clouds. “At the moment, it actually says nothing about a possible cosmic-ray effect on clouds and climate, but it’s a very important first step,” he says.

Here is the video:

Here is the founder and principle scientist talking more about CLOUD:

Dr. William Happer Speaks To The Benefits Of CO2 (UPDATED)

Here is an updated article in regards to the newer wave of those “skeptics” coming in from the “cold”

…William Happer, professor emeritus of physics at Princeton University and a member of the National Academy of Sciences, is similarly optimistic. “I think we’re making progress,” Happer said. “I see reassuring signs.”

Despite harsh criticism of their contrarian views, a few scientists like Happer and Curry have pointed to evidence that global warming is less pronounced than predicted. They have also argued that this slighter warming would bring positive developments along with problems. For the first time in years, skeptics believe they can find a path out of the wilderness into which they’ve been cast by the “scientific consensus.” As much as they desire a more open-minded reception by their colleagues, they are hoping even more that the spigot of government research funding – which dwarfs all other sources – will trickle their way.

[….]

They cite an adage: You only get answers to the questions you ask.

“In reality, it’s the government, not the scientists, that asks the questions,” said David Wojick, a longtime government consultant who has closely tracked climate research spending since 1992. If a federal agency wants models that focus on potential sea-level rise, for example, it can order them up. But it can also shift the focus to how warming might boost crop yields or improve drought resistance.

While it could take months for such expanded fields of research to emerge, a wider look at the possibilities excites some scientists. Happer, for one, feels emboldened in ways he rarely has throughout his career because, for many years, he knew his iconoclastic climate conclusions would hurt his professional prospects….

See also, “Breathing Causes Asthma.” (Drop down to the Acid Rain Myth if you wish.)

This from the Examiner.com, about the above exchange:

CNBC invited Dr. William Happer to speak on benefits of CO2. Examiner covered Dr. Happer and former astronaut Harrison Schmitt’s enlightened article in the Wall St. Journal.

The video, seen here, divulges the mythology that surrounds the much maligned molecule. And, if CNBC viewers thought that Dr. Happer was invited to answer questions, he received little time to do that.

Joe Kernan, co-anchor of CNBC’s “Squawk Box,” did his best to bring out the benefits of CO2 to his audience. As if his own questions to Happer wouldn’t be enough, he added four other broadcast reporters to the panel.

Repeated interruptions along with explanations of current misconceptions of the panel members limited Happer’s response time to a minimum. Of the 9-minute session, Happer spoke for a mere 2 minutes.

Still, in those mere minutes, the erudite scientist got his points across, albeit without being allowed elaboration.

  • On 97% of scientists agreeing on global warming, Happer responded that the number is “phony.”
  • On rising CO2 as the cause of warming, Happer rather cited increasing CO2 as a result of historical temperature rise rather than the cause.
  • On current warming, Happer reiterated the temperature record of no warming since 1998.
  • On stronger storms, Happer cited no such evidence is found in the data.
  • On the climate models, Happer declared that they need revisiting and represent a “secular religion.”
  • On the impact of increased CO2 on humans, Happer said that much higher levels are safe as sailors in submarines breathe 800 ppm for months at a time. Also, the human race developed in ancient atmospheres of 4,000 ppm of CO2.

The CNBC newscasters might have been well intentioned and seeking the truth from a science perspective. The panel members knew more than most on the complex subject, but they exposed their biases right off the bat, challenging Happer about what a physicist would know about climate science, then loaded the panel with talkative newscasters seeking their own air time instead of answers.

The session concluded with unintelligible arguing among the panelists, as if truth would somehow arise from whomever argued loudest. All this, while the benefits of CO2 from studies of undoctored evidence was stifled to silence despite Happer’s good efforts to deliver one-liners based on science rather than politics.

Here are two plants, one at higher PPM of CO2 and the other at what some scientist say is the best PPM for humanity. As you can see, during warming times in our past (for instance, the Romans grew grapes for wine on the Salisbury Plain)

Some points taken from another blogpost to show how some things in the past are different (warmer) than modern CO2 burnin’ man:

(1) Mars (New Scientist) has had a bout of global warming… last I checked Exxon doesn’t drill there;

(2) In the 8th century AD, the Roman Empire grew grapes used for wine on the slopes of Salisbury Plain (about 80 miles southwest of London) in the United Kingdom;

(3) The Vikings raiding and traveling the seas was made possible by the now frozen “Greenland”actually living up to its name;

(4) NASA‘s “fact” that 1998 was the warmest year (used by Al Gore) was disproved by an amateur mathematician;

(5) In 1970′s, at the first Earth Day rally, scientists, meteorologists and politicians all pushed a theory that there was Global Cooling (Time magazine for instance). While this theory wasn’t as embedded in popular thinking and scientific literature as is global warming, it was still the dominant theory of that time;

(6) There is more ice now that 29-years ago; Antarctic sea ice more than in 1979;

(7) In the 1500′s till the late 1800′s passages that are now iced over allowed for what is termed as the Northwest Passage… Exxon or cars weren’t around then?

“If you are like me and bit foggy on the Northwest Passage, here is a five cent refresher. The British coined the term Northwest Passage for the potential northern oceanic pass that would allow vessels to move between the Atlantic and Pacific Oceans. The earliest explorations for the fabled passage were by Cortes in 1539. The late 1500′s were marked by British explorers, Martin Frobisher, Humphrey Gilbert, and John Davis. Several expeditions followed, all with little success of finding the passage but tempered by the acquisition of new lands. Some attempts lead to deaths of entire crews. Notable of these is the Sir John Franklin expedition in which all of the crew members were lost to starvation, scurvy, cannibalism, and lead poisoning from food sealed in tins. The first to transverse the Northwest Passage was Sir Robert McClure using a combination of both sledge and ship. Ironically this was done during the search for Franklin’s team in which McClure’s own ship became trapped in the ice for three winters. The passage was finally conquered entirely by sea by the Norwegian Amundsen in 1906.”

(8) Acid rain scares of the 1980′s were mostly unfounded and not man-caused (see below);

(9) On the northern side of Mammoth (in California), there are tree-lines that were preserved by a volcanic eruption in A.D. 1350. In this preserved tree-line there were seven species of tree that grew well above the current tree-line in this mountainous range. The Earth would have to be 3.2 degrees warmer (Celsius) in order for these particular trees to grow in this higher altitude.

ACID RAIN MYTH:

The first section below is a good overview of what the second section shows in-depth.

Myth: Acid rain has caused a large portion of U.S. lakes to become acidic.

Fact: In a recent study of 7,000 Northeastern lakes, only 3.4% were found to be acidic. Most of these lakes are just as acidic as they were before the Industrial Revolution. Furthermore, most of the acidic lakes in the United States are in Florida, where there is the least acid rain.

Myth: Data taken by proponents of the acid rain theory is accurate and conclusive.

Fact: Proponents of the acid rain theory have rested their claims on a deeply flawed series of articles by G.E. Likens and his co-workers in the 1970s. A careful evaluation of Likens’ research conducted by a group of scientists at Environmental Research and Technology, Inc., reveals that his data collection and selection was deliberately biased to support the desired conclusions.

Myth: Acid rain destroys vegetation.

Fact: Acid rain actually has a positive impact on vegetation. The nitrogen and sulfur characteristic of acid rain, act as nutrients essential for plant growth. The world’s first acid rain study concluded that, “the principle effect of acid rain is the improvement of crop yields and crop protein content.”

Myth: Acid Rain is unnatural.

Fact: Rainwater is naturally acidic. Because water is such a good solvent, even in the cleanest air, rainwater dissolves some of the naturally present carbon dioxide, forming carbonic acid. According to EPA regulations, Ph levels any lower than 5.0 are environmentally harmful. Yet, an analysis of ice from the Antarctic and the Himalayas, deposited hundreds and thousands of years ago when the environment was presumably pristine, had Ph values ranging from 4.8 to 4.2.

  • Information from Environmental Overkill by Dixy Lee Ray (Regnery Gateway, 1993); Trashing the Planet by Dixy Lee Ray (Regnery Gateway, 1990).

This next section can be read in full online, and comes from Edward Krug’s book, Environment Betrayed: The Abuse of a Just Cause (Kindle Edition), from the chapter on “Acid Rain: Forests and Fish.”

ABSTRACT

Acid rain first came to public attention with claims that it was rapidly killing forests and lakes on a broad basis. To assess the accuracy of these claims, Congress initiated the largest study to date of an environmental problem: the ten-year, $500′-million National Acid Precipitation Assessment Program (NAPAP), which involved over three thousand scientists. NAPAP determined that acid rain may present a threat to one species of tree in 0.1 percent of eastern forests. The percentage of acidic lakes was also found to be much smaller than previously believed and not measurably increasing. Nevertheless, these scientific findings had little apparent impact on legislation passed in 1990, having been judged by some to be “not policy relevant.”

INTRODUCTION

George Will’s column of January 8, 1992, indicates that mainstream journalists are beginning to get the idea that in the hands of environmental advocates, estimates of environmental damage take on lives of their own, with few ties to reality. In the column, Mr. Will mused, “Whose interests are served by a numerical exaggeration? The answer often is: the people whose funding or political importance varies directly with the perceived severity of a particular problem” (Will, 1992).

Just about everyone of public importance had some sort of stake in acid rain being an environmental Armageddon. The scientific reality of the effects of acid rain differ enormously from public perception. And this is important for the setting of environmental policy because, unlike scientific fact, political reality in a democracy is established by vote.

The enormous gulf between fact and perception was brought out in the 60 Minutes story on acid rain (December 30, 1990). Correspondent Steve Kroft asked Dr. James Mahoney (then director of NAPAP) about the media representing acid rain as making a “silent spring” in the forests and lakes of the Northeastern United States. Director Mahoney commented that the media accounts of damage were overblown by quite a bit. When pressed why such fiction, rather than science, is being reported, Dr. Mahoney refused to address this issue and answered that his job is to do the science, not the reporting.

Yet the EPA had no such reservations about commenting, and commenting strongly, on media reporting. The EPA blasted the 60 Minutes acid rain story in a lengthy and detailed response claiming that outrageous statements were made (EPA, 1991). Let us examine the peculiar responses of the EPA, our public servant of environmental policy.

As a scientist, I can see how the EPA would have been upset by some of the comments made on 60 Minutes. The EPA is the lead federal agency of NAPAP. EPA Administrator Reilly is chairman of the President’s Joint Chairs Council, which oversees NAPAP. So I would have thought that the EPA would have been upset by the remark of David Hawkins (an activist for the Natural Resources Defense Council) who in effect told 60 Minutes that NAPAP has been a waste of time and money. And further, he said that in its ten years of existence, NAPAP has only confirmed what was known ten years ago!

Peculiarly, the EPA did not indicate any offense at all with this statement. But as a NAPAP scientist, I certainly was offended. We must remember that the United States almost did not have a NAPAP. In 1980, public opinion was very strong against waiting ten years for NAPAP to complete its study. Environmental activists established the conventional wisdom that by 1990 it would be too late: Rachael Carson’s prophesy of a “silent spring” would come to pass, with acid rain forever killing forests and lakes, by 1990.

Only a recalcitrant President Reagan, allied with Midwest rust-belt legislators, stood in the way of environmentalists’ demands. But the pressure became even too much for President Reagan who, by the end of 1983, was ready to capitulate. In late January/early February 1984, I was one of a committee of scientists who were asked to advise EPA Administrator Ruckelshaus on the choice of continuing research on acid rain or passing a new Clean Air Act. What the government would do hinged on how we answered the following question: will eastern North America survive five more years (will it survive until 1989) under the fierce onslaught of acid rain? The question seems ludicrous now, but back in 1984, it was considered foolish and immoral for anyone to even ask this question. President Reagan stayed with NAPAP.

Now we know that NAPAP’s findings did not confirm what was known ten years ago in 1980, as Mr. Hawkins claimed. And Mr. Hawkins of the Natural Resources Defense Council is in the position to know this firsthand because this is the same Mr. Hawkins who was appointed by President Carter as the EPA assistant administrator responsible for acid rain. President Carter, then Mr. Hawkins’s boss, told the American public in 1980 that acid rain was one of the two most severe atmospheric environmental problems of the century. And Mr. Hawkins’s EPA lent the appearance of scientific credibility to President Carter’s assertion by publishing that the average Northeast lake had been acidified a hundredfold over just the last forty years as the result of acid rain (EPA, 1980)—a statement that has no basis in fact. Yet, by 1990 the EPA’s own research, as part of NAPAP, showed that, even in the Adirondacks, the area whose lakes are supposed to suffer the greatest acidification by acid rain, EPA data show that the average lake is no more acidic now than it was before the industrial era (Krug and Warnick, 1991).

The EPA produced a six-page, single-spaced rebuttal to what it considered outrageous statements made on 60 Minutes (EPA, 1991). Was the EPA response to 60 Minutes concerned about Hawkins’s assertion about wasted research dollars? No. Or about research results substantiating the public perception of 1980? No.

Yet EPA Administrator Reilly wrote in a letter to Science: “In the Senate hearings on my confirmation as EPA Administrator, the first criterion that I mentioned for an effective environmental policy was ‘respect for science'” (Reilly, 1990).

I could understand if Mr. Reilly were concerned about Mr. Hawkins having a less-than-respectful attitude for science on 60 Minutes when he said that NAPAP scientists were unable to see damage because we have very crude scientific tools but that the American public can look out their windows and see the damage being done. Mr. Hawkins then went on to characterize us as backpacking around in the woods.

Yet again, the EPA, which considers itself to be a scientific agency and is the lead agency of NAPAP, an agency whose administrator publically claims to have “respect for science,” did not indicate any offense at all with this statement.

What really offended the EPA? I was asked to comment on Mr. Hawkins’s characterization of us NAPAP scientists as not being able to see anything because we were larking around in the woods with crude scientific tools. I responded, “Actually we do know a lot. We know that the acid rain problem is so small that it’s hard to sec.”

The EPA took great offense to that statement.

The EPA promptly carried out an ad hominem attack on me! This was done even though I have letters from the EPA itself calling me a recognized leader in acid rain—even though I have been used by the EPA itself to review its acid rain programs, and I have even been used to advise Administrators Ruckelshaus and Thomas of the EPA about acid rain.

The EPA also released comments from an alleged peer review of a project report I published for NAPAP two years earlier. I call it an alleged peer review because:

  1. The first time I had heard of it was when a Washington Post reporter called me up on January 11, 1991—twenty-one months after the report was published.
  2. The report was peer-reviewed by NAPAP prior to publication. The EPA’s comments did not come from the NAPAP review of the report.
  3. I have yet to see a copy of this alleged peer review even after making a freedom of information request on January 14, 1991, to EPA Administrator Reilly to see it.

We can now begin to understand why the scientists who conducted the Adirondack lakes study for the EPA—the study that showed no net acidification—refused to publish this result. Similarly, the results of the EPA’s largest acidification research project—where no correlation could be found between acid rain and surface water acidity, and soil chemistry is the principal factor controlling the acidity of surface waters (EPA, 1989)—was not published by EPA scientists in the scientific literature. So, after waiting for up to two years for these data to be published, I finally published them in a letter to Science last fall (Krug and Warnick, 1991).

We see that, as public servants and as holders of the public trust, the EPA is unconcerned about public misinformation that exaggerates acid rain as an environmental problem. The EPA is unconcerned about science bashing in the media. Indeed, the EPA even partakes in it.

In conclusion, George Will’s column of January 8 hit the nail on the head: in the hands of environmental advocates, estimates of environmental damage take on lives of their own, with few ties to reality. As Mr. Will concludes, those who exaggerate are those whose funding or political importance varies directly with the perceived severity of a particular problem.

The reason why the public is so well misinformed on acid rain is that the environmental advocates are not just Greenpeace and the Sierra Club. Just about everybody gains from the acid rain myth—everybody, that is, except you and me. The EPA likes it because, in terms of regulation, the 1990 Clean Air Act is ten times bigger than any previous environmental legislation, including the Clean Air Act of 1970. The government likes it because it gains more popularity, power, and control as government is seen doing something good for little cost; most environmental costs are off budget, being paid directly by the consumer. The media likes it because environmentalism is a just cause depicted in terms of good-versus-evil, David-versus-Goliath battles. Environmentalists hand the media popular and spectacular disaster stories pitting the blue-jeaned defenders of Mother Earth from the three-piece-suit Darth Vaders of big business, in this case, utilities spewing forth acid rain. The utilities like it because they get to pass on higher utility rates, along with increased profits, from the Public Utility Commissions onto you and me because we, the well-misinformed public, are demanding to be protected from the scourge of acid rain.

What a sweet setup!

Small wonder why scientists refuse to publish data showing acid rain has little or no measurable effect. When another acid rain scientist was asked by a magazine reporter why Ed Krug would take it upon himself to publish politically incorrect science, my colleague replied, “He was a bit immature in the area of political science” (Anderson, 1992).

On that note, let us quickly examine what political science has done to the science of acid rain.

POLITICAL SCIENCE: HISTORY

It is a little-known fact that the European and American acid deposition monitoring networks originated in the national agricultural experiment stations; these have been sampling and analyzing atmospheric deposition of N [nitrogen] and S [sulfur] for more than a century, not as contaminants but as beneficial nutrients (Krug, 1991). Among agronomists, such “pollution” was often called the poor man’s fertilizer. In Sweden, the world’s first national acid rain study determined that the principal effect of acid rain was improvement of crop yield and crop protein content (e.g., Johansson, 1959).

However, the insertion of the term “acid rain” into the modern literature and psyche by Likens and associates in 1972 “caught the attention of the scientific community as well as the public at large” (Abdullah, 1989). The deposition. How could anything called “acid rain” be anything but bad? So the results of the Swedish program became lost in history, and any scientist who brought up the point that acid rain might have a good side was ridiculed into oblivion.

Later on, NAPAP would report on the fertilizing effect of acid rain on forests, but would emphasize the negative potential of it. Fertilization of high altitude forest by acid rain, 0.1 percent of our eastern forests, may be increasing cold damage by making forests grow too long into the winter. The potential beneficial effects of fertilization on the remaining 99.9 percent of eastern forests remain safely buried in voluminous technical reports—reports little read by interested specialists, let alone by policy makers and the public.

Around the time that Likens and associates used two little words to permanently change the way that we think about deposition of N and S, the Norwegian national acid rain program came into existence.

The Norwegian national acid rain program of the 1970s, not the Swedish program of the 1940s and ’50s, established the research perspective of the subsequent American, Canadian, and European national acid rain programs. Regrettably, the proposal (Nr. 172/1974) to the Norwegian parliament for financing the program stated that “the aim of the project is to provide material for negotiations in order to limit the emission of SO2 in Europe” (Rosenqvist, 1990). Thus, scientific objectivity was lost from the inception; politicians proclaimed that acid rain is a problem and would pay those scientists who would support the political position.

Thus, political correctness came to acid rain twenty years ago.

A similar situation was manufactured in the United States. As the Norwegian program was ending in 1980, President Carter called acid rain one of the two atmospheric environmental crises of the century and started NAPAP at $10 million per year for ten years.

Thus, the inception of NAPAP was hardly scientifically objective either. And, at $10 million per year, NAPAP was merely window dressing to provide the appearance of scientific credibility for the claims of environmental disaster.

Remember, NAPAP was supposed to be investigating the sources of acid rain, its atmospheric chemistry and transport, as well as its myriad claimed effects, such as visibility, effects on crops, effects on forests, effects on lakes, effects on buildings, effects on human health. Then you take all of these effect and research areas and divide them among all of the participating agencies: the US Park Service, the US Geological Survey, the US Forest Service, the Tennessee Valley Authority, the US Department of Agriculture re, National Oceanic and Atmospheric Administration, National Aeronautics and Space Administration, the national laboratories, Department of Health and Human Services, Department of Energy, Department of Commerce, and (last but not least) the Environmental Protection Agency, and you see that $10 million per year will hardly pay the salaries of the administrative paper pushers, let alone support any meaningful research.

NAPAP was originally set up to put a rubber stamp on the false claims of disaster. It was not set up to do science.

This changed after 1984, when the Reagan administration asked for scientific rather than political opinion. We scientists reported to the administration that, contrary to popular belief, the world was nor going to end soon because of acid rain. Please let us do the science.

President Reagan’s response was not to push for a new version of the Clean Air Act. Not only did he continue NAPAP, but he increased NAPAP’s budget tenfold to around $100 million per year so that it could finally get around to doing meaningful scientific research on acid rain.

With the new budget and the emphasis now being on science, NAPAP also got a scientist to be its new director, Lawrence Kulp, a former director of the Lamont Geochemical Laboratory at Columbia University.

This made environmentalists furious. NAPAP became distinct from all other national acid rain programs: it was evolving into a scientific entity rather than remaining a creature of environmental politics. Since NAPAP was no longer likely to rubber stamp the claims of disaster, environmental activists would discredit NAPAP with the help of its powerful allies in the media and government, which most importantly included the EPA. And the EPA was NAPAP’s lead federal agency.

Thus NAPAP was not able to produce perfectly objective science. However, we must commend NAPAP for performing far better than we have any right to expect; NAPAP was overwhelmingly besieged from both within and without.

You can measure the success of NAPAP by environmentalists criticism of it and their vehement objections to the establishment of a “NAPAP” for global warming….

Heliocentrism vs. Geocentrism ~ Can Both Right? Dr. Stokes Explains

(Video Description) “How To Be a Real Skeptic” ~ Mitch Stokes, PhD. Mitch Stokes, professor at New Saint Andrews College, gives a talk on skepticism at Collegiate Reformed Fellowship’s weekly meeting.

Can there be dueling theories for the same observable evidence? Can BOTH be true? In this smaller portion of his larger talk (http://tinyurl.com/jwm3lcd), Dr. Stokes explains with a story of two theories that at the time were equally true.

Dr. Stokes book, “A Shot of Faith {To The Head}” — Can be found here: http://tinyurl.com/pmmx9rh

BTW: This fuller presentation is applicable not only to religious, or origin type debates, but especially to the current flap over global warming, or climate change… or, er… climate disruption. Whatever its called.

Often times one’s bias, worldview, and presuppositions drive outcomes. It is natural, we all do it. Read more in my first chapter: http://www.scribd.com/doc/34407776/Introduction-Technology-Junkies

Professor Nadine Unger “Says” Elementary Students Mass Murderers…

…Sorta

Video Description:

Dennis Prager reads from another New York Times column about how the Left views nature. How does the Left view nature Papa Giorgio? Through a kaleidoscope of “crazy.”

Dr. Nadine Unger, in her column (http://tinyurl.com/l9ds4ql), basically tells all those kids planting trees that they are murderers.

Well… maybe Miss Unger didn’t, but they did: “At one point, the march [in NY] briefly came to a halt, as demonstrators held a moment silence for what they described as victims of the climate crisis” (http://tinyurl.com/m9jmnk7). I guess elementary student are now on the same level as Pol-Pot, Mao, and Stalin? Following conclusions to their logical end.

For more clear thinking like this from Dennis Prager… I invite you to visit: http://www.dennisprager.com/

Hiding the Real Data-Sets Behind the Headlines

Claim: ‘World will warm faster than predicted in next five years’, study warns – ‘Expected to silence global warming skeptics’

Above is one example of a failed Guardian prediction. Another one is midway down… but these scare tactics work to push legislation of political goals. Not science.

1) there is a calculable atmospheric concentration of green house gasses that *necessarily* correlates to an atmospheric temperature

2) there is such a temperature at which biology is chemically impossible

(The Pit)

What we know is that CO2 is not having any effect on climate, like the “disruptionists” would have us believe. And while there is a temperature at which life cannot exist — d u h ! — in the past we have been a few degrees warmer than current temperatures — and history shows us that civilization flourished during these “dangerous” times. Some of the below works through these ideas.


ESPIONAGE

There seems to be a misunderstanding by the general public of the NOAA and other organizations and how they misuse data points (or average them wrongly).

So, for instance, professor Mueller at Berkeley mentions how climate “scientists” were hiding the decline in the past:

They were skewing the numbers in other words. This is an example of fraud. But numbers can be skewed by faulty or outdated methods/equipment. For instance,

EQUIPMENT FAIL

Here are some examples of fudged data because of sub-standard equipment:

You’d think the answer would be obvious, but here we have a NOAA operated USHCN climate station of record providing a live experiment. It always helps to illustrate with photos. Today I surveyed a sewage treatment plant, one of 4 stations surveyed today (though I tried for 5) and found that for convenience, they had made a nice concrete walkway to allow servicing the Fisher-Porter rain gauge, which needs a paper punch tape replaced one a month.

Here is what you see in visible light:

Here is what the infrared camera sees:

Note that the concrete surface is around 22-24°C, while the grassy areas are between 12-19°C

This station will be rated a CRN5 by this definition from the NOAA Climate Reference Network handbook, section 2.2.1:

Class 5 (error >~= 5C) – Temperature sensor located next to/above an artificial heating source, such a building, roof top, parking lot, or concrete surface.”

More than half of the stations the NOAA use are tainted or wrongly placed equipment.

CHANGING DATA-SETS

Another example of changing averages was noted by Steve Goddard and others — even the NOAA have acknowledge it — have been discussing recently is exemplified in Dr. Judith Carry’s post on the matter (from a larger post of mine):


Even the Wall Street Journal chose the higher temperature reading to say that July of 2012 was July was the “hottest month in the contiguous U.S. since records began in 1895.” WUWT found this on accident and it has led to quite a few other revelations as we will see. Here is description in part of what we looking at:

Glaring inconsistencies found between State of the Climate (SOTC) reports sent to the press and public and the “official” climate database record for the United States. Using NCDC’s own data, July 2012 can no longer be claimed to be the “hottest month on record”.

[….]

I initially thought this was just some simple arithmetic error or reporting error, a one-off event, but then I began to find it in other months when I compared the output from the NCDC climate database plotter. Here is a table of the differences I found for the last two years between claims made in the SOTC report and the NCDC database output.

[….]

In almost every instance dating back to the inception of the CONUS Tavg value being reported in the SOTC report, there’s a difference. Some are quite significant. In most cases, the database value is cooler than the claim made in the SOTC report. Clearly, it is a systemic issue that spans over two years of reporting to the press and to the public.

It suggests that claims made by NCDC when they send out these SOTC reports aren’t credible because there are such differences between the data. Clearly, NCDC means for the plotter output they link to, to be an official representation to the public, so there cannot be a claim of me using some “not fit for purpose” method to get that data….

The Wall Street Journal made a graph showing this record setting month (left). The more accurate temperature for July likewise is shown in the same graph (right):

This looking at the data sets chosen and what is used and isn’t used to support an idea that fails in every way. Combine this obvious cherry-picking with the bias, collusion, and charges against the report that the President used to route Congress, all show we have a problem Houston! But this is only the tip of the proverbial iceberg. It seems the NOAA has been skewing these temps for some time. Why? Because the left uses this as a way to promote an ever growing government and the scientists get more-and-more funding. This data fudging story is newer, and it is evolving quickley, including this newest post via Real Science where Steve Goddard notes that More Than 40% Of USHCN Station Data Is Fabricated. Here is Dr. Judith carry’s synopsis (excerpted), in which she critiques a bit Goddard’s post… but then bows to the evidence:

OK, acknowledging that Goddard made some analysis errors, I am still left with some uneasiness about the actual data, and why it keeps changing. For example, Jennifer Marohasy has been writing about Corrupting Australian’s temperature record.

In the midst of preparing this blog post, I received an email from Anthony Watts, suggesting that I hold off on my post since there is some breaking news. Watts pointed me to a post by Paul Homewood entitled Massive Temperature Adjustments At Luling, Texas. Excerpt:

So, I thought it might be worth looking in more detail at a few stations, to see what is going on. In Steve’s post, mentioned above, he links to the USHCN Final dataset for monthly temperatures, making the point that approx 40% of these monthly readings are “estimated”, as there is no raw data.

From this dataset, I picked the one at the top of the list, (which appears to be totally random), Station number 415429, which is Luling, Texas.

Taking last year as an example, we can see that ten of the twelve months are tagged as “E”, i.e estimated. It is understandable that a station might be a month, or even two, late in reporting, but it is not conceivable that readings from last year are late. (The other two months, Jan/Feb are marked “a”, indicating missing days).

But, the mystery thickens. Each state produces a monthly and annual State Climatological Report, which among other things includes a list of monthly mean temperatures by station. If we look at the 2013 annual report for Texas, we can see these monthly temperatures for Luling.

Where an “M” appears after the temperature, this indicates some days are missing, i.e Jan, Feb, Oct and Nov. (Detailed daily data shows just one missing day’s minimum temperature for each of these months).

Yet, according to the USHCN dataset, all ten months from March to December are “Estimated”. Why, when there is full data available?

But it gets worse. The table below compares the actual station data with what USHCN describe as “the bias-adjusted temperature”. The results are shocking.

In other words, the adjustments have added an astonishing 1.35C to the annual temperature for 2013. Note also that I have included the same figures for 1934, which show that the adjustment has reduced temperatures that year by 0.91C. So, the net effect of the adjustments between 1934 and 2013 has been to add 2.26C of warming.

Note as well, that the largest adjustments are for the estimated months of March – December. This is something that Steve Goddard has been emphasising.

It is plain that these adjustments made are not justifiable in any way. It is also clear that the number of “Estimated” measurements made are not justified either, as the real data is there, present and correct.

Watts appears in the comments, stating that he has contacted John Nielsen-Gammon (Texas State Climatologist) about this issue. Nick Stokes also appears in the comments, and one commenter finds a similar problem for another Texas station.

Homewood’s post sheds light on Goddard’s original claim regarding the data drop out (not just stations that are no longer reporting, but reporting stations that are ‘estimated’). I infer from this that there seems to be a real problem with the USHCN data set, or at least with some of the stations. Maybe it is a tempest in a teacup, but it looks like something that requires NOAA’s attention. As far as I can tell, NOAA has not responded to Goddard’s allegations. Now, with Homewood’s explanation/clarification, NOAA really needs to respond….

(H/T to Climate Realist ~ See WUWT and Hockey Schtick for more)


So we see in the above, that temperatures can be changed years later as the totality of the data is included. What was considered the hottest falls to just an average month in the heat index.

And this has — within the past few months — turned into a very large debate.

EQUIPMENT FAIL II

Here is another example of older/faulty equipment:

A Quick Note about the Difference between RSS and UAH TLT data

There is a noticeable difference between the RSS and UAH lower troposphere temperature anomaly data. Dr. Roy Spencer discussed this in his July 2011 blog post On the Divergence Between the UAH and RSS Global Temperature Records.  In summary, John Christy and Roy Spencer believe the divergence is caused by the use of data from different satellites.  UAH has used the NASA Aqua AMSU satellite in recent years, while as Dr. Spencer writes:

…RSS is still using the old NOAA-15 satellite which has a decaying orbit, to which they are then applying a diurnal cycle drift correction based upon a climate model, which does not quite match reality.

I updated the graphs in Roy Spencer’s post in On the Differences and Similarities between Global Surface Temperature and Lower Troposphere Temperature Anomaly Datasets.

While the two lower troposphere temperature datasets are different in recent years, UAH believes their data are correct, and, likewise, RSS believes their TLT data are correct.  Does the UAH data have a warming bias in recent years or does the RSS data have cooling bias?  Until the two suppliers can account for and agree on the differences, both are available for presentation.


ROSE COLORED GLASSES

Another example of competing ideas is this example from two major UK papers, the first being from the Guardian:

This next one from the Daily Mail:

(Daily Mail) ….The most widely used measurements of Arctic ice extent are the daily satellite readings issued by the US National Snow and Ice Data Center, which is co-funded by Nasa. These reveal that – while the long-term trend still shows a decline – last Monday, August 25, the area of the Arctic Ocean with at least 15 per cent ice cover was 5.62 million square kilometres.

This was the highest level recorded on that date since 2006 (see graph, right), and represents an increase of 1.71 million square kilometres over the past two years – an impressive 43 per cent.

Other figures from the Danish Meteorological Institute suggest that the growth has been even more dramatic. Using a different measure, the area with at least 30 per cent ice cover, these reveal a 63 per cent rise – from 2.7 million to 4.4 million square kilometres.

[….]

Crucially, the ice is also thicker, and therefore more resilient to future melting. Professor Andrew Shepherd, of Leeds University, an expert in climate satellite monitoring, said yesterday: ‘It is clear from the measurements we have collected that the Arctic sea ice has experienced a significant recovery in thickness over the past year.

‘It seems that an unusually cool summer in 2013 allowed more ice to survive through to last winter. This means that the Arctic sea ice pack is thicker and stronger than usual, and this should be taken into account when making predictions of its future extent.’

Same data used, one says BEWARE, the END IS NEAR, the other says making gains, as the graph shows below:

(So are Polar Bears, BTW) And the Antarctic has made BIG GAINS. But if the left — yes, the left — says we should renter the little ice-age to be at a normal point of “climate disruption,” then they are living a pipe-dream. As the earth gets warmer life flourishes, as warmer periods in history have exemplified:

June was ranked one of the coldest months in a while. According to the NOAA, July 2014 ranked 29th coldest out of 120 using the Maximum temperature. And so we enter the discussion about if the pause is real… which is now being acknowledged by almost all (except the IPCC).

PAUSE

Here is Dr. Judith Curry posting ion the subject before getting into two papers that talk about it from two points of view:

With 39 explanations and counting, and some climate scientists now arguing that it might last yet another decade, the IPCC has sidelined itself in irrelevance until it has something serious to say about the pause and has reflected on whether its alarmism is justified, given its reliance on computer models that predicted temperature rises that have not occurred. – Rupert Darwall 

The statement by Rupert Darwall concisely states what is at stake with regards to the ‘pause.’   This seriously needs to be sorted out….

For a running — updated — list of these excuses mentioned above, see here. What HAS been clearly shown is that while some wish to make CO2 illegal, CO2 is in fact not driving the climate:

GROUP-THINK

What is being shown as of late is that more-and-more scientists are becoming concerned with the group-think in the climate-sciences. Again, Dr. Judith Curry was the biggest pro-AGW proponent, but has — like many others leaders in their respective field — changed or softened her/their positions on what the science is actually showing:

The implications of dogmatic groupthink and intimidation for the pursuit of sound science — and sound policy — are chilling. – Christopher Snowden

A collection of articles from the health science community on the fate of papers and scientists that challenge the consensus.

SUN & OCEAN

  • Gross Scientific Negligence – IPCC Ignored Huge Body Of Peer-Reviewed Literature Showing Sun’s Clear Impact – See more at: http://tinyurl.com/kw47zcf (NASA is changing on this as well)
  • NASA is saying the sun — thanks to the Goddard Institute studying this, is the driver of warming and cooling: http://tinyurl.com/m29yo99 (Via Hockey Shtick)

And yet another study is showing the sun as the major player… NOT greenhouse gases.

So what’s the bottom line? NOAA temps change over time. Many in this respective field are seeing group-think. Ideology is driving this group-think, not science.

Why should you be interested? Sea surface temperature records indicate El Niño and La Niña events are responsible for the warming of global sea surface temperature anomalies over the past 30 years, not man-made greenhouse gases. I’ve searched sea surface temperature records for more than 4 years and ocean heat content records for more than 3 years, and I can find no evidence of an anthropogenic greenhouse gas signal in either dataset. That is, the warming of the global oceans has been caused by naturally occurring, sunlight-fueled, coupled ocean-atmosphere processes, not anthropogenic greenhouse gases.

(From the newest global temp data-set at WUWT)

No matter what evidences one puts forward, until people remove their rose-colored glasses, they will continue to explain away the pause showing CO2 has nothing to do with global temperatures.

Global Warming Fear Mongering (1988 Flashback: Maldives Edition)

Here is an example of failed predictions that new orgs love to report for their “immediacy” of danger… which makes news “exciting” ~ click to isolate this 1988 prediction:

This seems odd in light of Maldives spending many millions of dollars to build two new airports.

Shouldn’t they be investing in life rafts? Or are Western busy-bodies the only ones really worried about “man-caused” global warming? Here is a Canadian Free Press story:

The Maldives in the Indian Ocean have long been used by global warming alarmists to drive home the dangers of rising sea levels should polar ice sheets keep melting because of man-made global warming. In 2012 former President of the Maldive Islands, Mohammed Nasheed, said, “If carbon emissions continue at the rate they are climbing today, my country will be under water in seven years.”

With such a prediction and recalling how the latest UN IPCC report boosted its estimate of sea level rise, taking into account that CO2 emissions show no signs of abating, you would think the Maldives would be the last place developers would build anything. The Maldives are barely more than a meter above sea level on average. Yet as Pierre Gosselin reports, “The tourist industry does not believe in the downfall of the Maldives. Thirty additional new luxury class hotel complexes are planned for the next 6 to 10 years, not counting the countless smaller homes. Tourism is currently increasing 20% annually. Whatever is really behind all the rising seal level scar stories, huge commercial investors are obviously dismissing them. If anything, these scare stories are providing lots of publicity for the island’s tourism industry. Already more than 1 million tourists are flocking to the islands every year and Nasheed says the island can handle many more.

The developers are on safe ground in spite of Nasheed’s dire warnings. There is a lot of science supporting the tourism industry’s belief that sea level rise is not a problem.

What — in our past — is still worse than today’s “scares” and droughts?

…read more…

Here is a quick synopsis of a really hard time in our countries history:

Compared to today’s stats via “the Palmer index,” while bad… it is not nearly as bad as it has been — nation wide:

Forbes has this excellent article about what responsible governments do… and what California does:

As we all know, the President and others are selling the canard that the current drought is the result of global warming or climate change.  The fact that we had decades- long droughts years before industrialization doesn’t matter to them as they bloviate over a drought of several years.

Simply stated, California government has other priorities – priorities which to them are far more important that ensuring that 38 million people have water. They include:

  • A High Speed Rail project, mired in lawsuits and of uncertain costs – at least $68 billion but perhaps double that amount, and
  • A 2004 $3 billion stem cell bond program ($6 billion with interest) that has produced no approved therapies but has, according to the AP, resulted in “the opening of sleek buildings and gleaming labs at a dozen private and public universities built with matching funds” without any cures in the pipeline.  Of course, now they want more money.

California legislators spend millions more on nonessential items like $2.7 million for a new swimming pool in Calexico near the Mexican border – during a drought.  California is also spending an additional $46.6 million to build up to 54 hydrogen fuel stations to serve a state of 158,648 square miles.  That is one station for every 2,938 square miles.  Hope you don’t get stranded.

Rather than waste money on such projects, which can’t possibly be more important than water, California should look to places like Singapore to learn what a responsible government should be doing. 

Singapore has but 247 square miles.  It is a population of nearly 4.5 million people.  Obviously, it has very little land for such things as reservoirs.   Instead, Singapore relies on 15 reservoirs, desalinated water, water reclamation, and imported water to meet their water needs.   

Singapore obviously made water production a priority for its tiny landmass that is 0.155% of California’s landmass, yet has 8.4% of California’s population.  That is what responsible governments do, and one reason why Singapore has the third highest per-capita GDPs in the world, despite its size and lack of natural resources….


REFUTATION of the ABOVE


(Originally posted December of 2014)

This is meant mainly as a supplement to a Christmas Eve-Eve gathering/discussion I was at. I will make this post  a little different than other posts, as, it will be “minimalist.” This is the third installment of the topics covered, which are polar bears, rising sea levels, CO2, Inconvenient Truth (the movie), nuclear power, warmest year, electric vehicles (EVs)/hybrid cars, and bullet trains.

One of the main “evidences” the students raised was “rising oceans” for global warming being true. These students are basically saying… “Because my professor said” … see for yourself (via Breitbart):

I wanted to draw the people who believe this (rising oceans) attention to a very old photograph compared to a new one to compare La Jolla (California) sea levels from 1871 to Now (REAL CLIMATE SCIENCE):

lajolla18712b

Also, Photographs show no change in Sydney sea level over the last 130 years (REAL CLIMATE SCIENCE):


There has been no change. ~ Real Science


AP’s Seth Borenstein publishes pure propaganda: Climate change has made Earth ‘hotter, weirder…downright wilder’

Borenstein: In the more than two decades since world leaders first got together to try to solve global warming, life on Earth has changed, not just the climate. It’s gotten hotter, more polluted with heat-trapping gases, more crowded and just downright wilder. Global temperature: up six-tenths of a degree. Population: up 1.7 billion people. Sea level: up 3 inches. U.S. extreme weather: up 30 percent. Ice sheets in Greenland and Antarctica: down 4.9 trillion tons of ice.  “Simply put, we are rapidly remaking the planet and beginning to suffer the consequences,” says Michael Oppenheimer, of Princeton University. Diplomats from more than 190 nations opened talks Monday at a United Nations global warming conference in Lima, Peru, to pave the way for an international treaty they hope to forge next year.

Climate Depot’s Morano comment: ‘AP’s Borenstein can be trusted to shill for UN’s climate summit in Lima Peru, which I will be attending and speaking at. Borenstein relies on Michael Oppenheimer (who is the UN scientists on the payroll of Hollywood stars) and Climategate’s Michael Mann. Borenstein ignores tide gauges on sea level  showing deceleration of sea level rise and ignores satellite temperatures which show the Earth in an 18 year ‘pause’ or ‘standstill’ of global warming. Borenstein tortues data in order to claim more weather extremes. We are currently at or near historic lows in tornadoes and hurricanes. Even droughts are on long term declines and floods show no trend. We know not to expect more from Borenstein.’ See: ‘Long sad history of AP reporter Seth Borenstein’s woeful global warming reporting’

  1. Sea level claims debunked here:
  2. Extreme weather claims debunked here:
  3. Greenland ice claims debunked here:
  4. Antarctica ice claims debunked here:
  5. Overpopulation claims debunked here

Breitbart makes fun of the idea that loans and insurance could ever be had if these Islands are soon to underwater… unless these banks and insurance companies know that “Climate Change” is more political than science

Great news from the scuba-diving tropical paradise Maldives. They’ve just opened another airport.

This means that the Indian Ocean island nation now has four international airports and seven domestic ones. Quite a lot for a country with a population of less than 400,000. Presumably they have high hopes for their tourist industry as they develop luxury resorts on ever more remote atolls.

[….]

Here’s the World Bank: “Climate change presents a challenge for every island in the Maldives, which all lie on the sea level. Any changes in the climate will greatly affect the Maldivian way of life.”

Here’s the UN Foundation: “Climate change is a serious threat to low lying islands like Maldives whose landmass is close to sea level. The projected rise in sea level over the next century due to climate change is commonly agreed to be about one meter.  The highest point on this island nation is one meter.  Learn more about the existential threat of climate change on this island and learn more about how the country is pressing for global action on climate change.”

And let us never forget the tragically moving, yet cheery-in-the-face-of-disaster underwater cabinet meeting staged by the Maldives government in 2009 to draw international attention to the terrible and imminent threat these poor islands face.

Luckily I have thought up a brilliant solution to this problem. Maybe the lucky Maldives (the thriving tourist paradise) could help the unlucky Maldives (the one about to be drowned by global warming) with money and material aid. Perhaps it could use its vast tourist revenues to mitigate against any problems caused by this terrible “climate change” thing. Perhaps it could use its 11 airports to help evacuate the other Maldives’ climate refugees.

(Gateway Pundit): Seven years ago ABC News warned viewers that New York City will be under water by 2015 due to global warming.

New York City underwater? Gas over $9 a gallon? A carton of milk costs almost $13? Welcome to June 12, 2015. Or at least that was the wildly-inaccurate version of 2015 predicted by ABC News exactly seven years ago. Appearing on Good Morning America in 2008, Bob Woodruff hyped Earth 2100, a special that pushed apocalyptic predictions of the then-futuristic 2015. The segment included supposedly prophetic videos, such as a teenager declaring, “It’s June 8th, 2015.”

“One carton of milk is $12.99.” (On the actual June 8, 2015, a gallon of milk cost, on average, $3.39.) Another clip featured this prediction for the current year: “Gas reached over $9 a gallon.”

The only way food would be soo high is if Obama’s war on affordable energy works it’s course! How come Manhattan property is through the roof!

(Breitbart) In 2006, on NBC’s Today Show, former-Vice President Al Gore predicted that Manhattan would be flooded in “15 to 20 years.” He added, “In fact the World Trade Center Memorial site would be underwater.” Just 3 years ago, the New York State Energy Research and Development Authority predicted that within the next ten years, “Irene-like storms of the future would put a third of New York City streets under water and flood many of the tunnels leading into Manhattan in under an hour because of climate change[.]”

By hook or crook, through super storms or glacier melt, Global Cooling Global Warming Climate Change has doomed the Big Apple.

What we have here are two of the most respected environmental voices among the political Left — Gore and the government — warning of dire flooding hitting Manhattan within the next 10 years. And at least according to their activism, the predominantly left-wing, Global Warming believers of Manhattan are listening. Furious about the lack of wealth-distribution that will save the planet and their small island, just 6 months ago, more than 300,000 took to the streets of Manhattan to protest.

And yet, a funny thing is happening in the real world of the free market. Manhattan might be the elite media/entertainment/intellectual hub of the cult of Global Warming, but where the rubber meets the bottom line, the cult obviously doesn’t really believe in its own propaganda. If they did, Manhattan real estate prices would be collapsing, not hitting record highs as they currently are.

If people truly believe an area is going to be flooded as soon as in the next decade, those same people would be selling off their real estate. Not just to escape but to sell before conditions worsened and real estate prices bottomed out further. As the deadline loomed closer, prices would decrease further.

What’s happening, though, is the exact opposite.

The average Manhattan home price is now over $1.7 million. With some apartment prices now breaking nine figures, it’s time to take a look at the booming New York real estate market and explore where middle class families fit into the picture.

At 157 West 57th Street, the most expensive New York home sale was just completed with the penthouse of this new building going for over $100 million.

Howard Lorber, the chairman of Douglas Elliman, the city’s largest residential brokerage, told me that there is no sign of this trend slowing down. He called New York a safe place for people around the world to invest in real estate.

Maybe what’s happening is that Manhattan’s left-wing Global Warming believers are suckering right-wing Climate Deniers into buying doomed real estate at record prices?

there’s more

JO NOVA catches us up with the latest studies involving islans shrinking:

This should end all the Pacific Island climate claims right here. A new study of over 700 islands for decades shows that even though seas are rising faster than any time in the last million years, somehow no islands with people on are shrinking. This means there are no climate change refugees from any vanishing island. Plus it’s more proof that highly adjusted satellite data is recording sea levels on some other planet.

Over the past decades, atoll islands exhibited no widespread sign of physical destabilization in the face of sea-level rise. A reanalysis of available data, which cover 30 Pacific and Indian Ocean atolls including 709 islands, reveals that no atoll lost land area and that 88.6% of islands were either stable or increased in area, while only 11.4% contracted.

Look how closely these researchers are tracking the shores. Below on Tuamoto, French Polynesia, scientists can tell you that islets 12 and 14 (see pic) have disappeared since 1962. So we can track roving blobs of sand about 20 to 30 meters across.

No Habitable Island, None, Got Smaller:

The researchers reckon that 10 hectares is about the smallest island you’d want to plonk a resort on, that’s about that is about ten Rugby fields. Conveniently for us, no island bigger than 10 hectares shrank despite the world adding two thousand coal fired plants and a billion cars.

[….]

See the graph. All the larger islands are staying the same size or growing.

WATTS UP WITH THAT has the abstract and the conclusion of the study. Here is the abstract:

Abstract: Over the past decades, atoll islands exhibited no widespread sign of physical destabilization in the face of sea-level rise. A reanalysis of available data, which cover 30 Pacific and Indian Ocean atolls including 709 islands, reveals that no atoll lost land area and that 88.6% of islands were either stable or increased in area, while only 11.4% contracted. Atoll islands affected by rapid sea-level rise did not show a distinct behavior compared to islands on other atolls. Island behavior correlated with island size, and no island smaller than 10 ha decreased in size. This threshold could be used to define the minimum island size required for human occupancy and to assess atoll countries and territories’ vulnerability to climate change. Beyond emphasizing the major role of climate drivers in causing substantial changes in the configuration of islands, this reanalysis of available data indicates that these drivers explain subregional variations in atoll behavior and within-atoll variations in island and shoreline (lagoon vs. ocean) behavior, following atoll-specific patterns. Increasing human disturbances, especially land reclamation and human structure construction, operated on atoll-to-shoreline spatial scales, explaining marked within-atoll variations in island and shoreline behavior. Collectively, these findings highlight the heterogeneity of atoll situations. Further research needs include addressing geographical gaps (Indian Ocean, Caribbean, north-western Pacific atolls), using standardized protocols to allow comparative analyses of island and shoreline behavior across ocean regions, investigating the role of ecological drivers, and promoting interdisciplinary approaches. Such efforts would assist in anticipating potential future changes in the contributions and interactions of key drivers.