Nobel laureate Ivar Giaever’s speech at the Nobel Laureates meeting 1st July 2015. Ivar points out the mistakes which Obama makes in his speeches about global warming, and shares other not-well known facts about the state of the climate.
Professor Ivar Giaever, the 1973 Nobel Prizewinner for Physics trashes the global warming/climate change/extreme weather pseudoscientific clap-trap and tells Obama he is “Dead Wrong”. This was the 2012 meeting of Nobel Laureates.
A great response to a mushy response to AGW skeptics, here is the typical charge:
Imagine your doctor tells you that you have dangerously high cholesterol and blocked arteries. She says you may drop dead soon. [Note: Based on comments/questions, I should clarify here. By “doctor”, I mean the entire medical establishment. So imagine you got not just a “second opinion,” but 100 opinions…and 97 say the same thing].You might have four basic reactions based on two dimensions, belief (or doubt) in the basic facts/science, and whether you commit to action or delay.
1. A medical doctor is a highly-qualified professional. Medical doctors must successfully complete a medical school, spend 3-7 years in residency actually treating patients, and be licensed by a state medical board composed mostly of proven doctors.
In contrast, anybody can call him- or herself a scientist and speak on behalf of science. There are no licensing or certification requirements….
[….]
2. A medical doctor is accountable. A doctor would lose patients or be fired if his or her advice isn’t sound. A doctor can also be sued by a dissatisfied patient. In a number of cases, doctors have been indicted.
A putative climate scientist can hardly even be criticized….
[….]
3. Patients have direct bidirectional communication with their doctor. “Direct” means that the patient usually speaks face-to-face with the doctor. “Bi-directional” means the patient can ask the doctor questions and get answers. Very few accept TV personalities’ talk as real medical advice.
The so-called “climate science” is usually communicated to the public in third person point of view like “The scientists say that …”, “Majority of peer-reviewed articles conclude …”, and even “Models show that …” These used to be typical introductory clauses before statements about alleged climate dangers…..
[….]
4. One takes initiative to seek a doctor, rather than the other way around. Any unsolicited email offering a medical procedure or a wonder pill is sent straight to the spam folder.
But climate alarmism promoters always come unsolicited! …
[….]
5. Doctors do not demand patients to trust them. They earn their trust.
Climate alarmists demand trust because they have earned mistrust.
I would like to finish by paraphrasing Edmund Burke:
Alleged science looks for defense from Washington when it fails in the real world.
Temple University Students for Intellectual Freedom (TUSIF) hosted Ann McElhinney, the Irish documentary film maker behind the documentary film “Not Evil, Just Wrong”, which debunks myths surrounding global warming. Also speaking on the panel were Jennifer Stefano, Director of Energy and Labor Policy, AFP-PA; and Tom Pyle, President, American Energy Alliance. The event concluded with an always-entertaining, outrageous Q&A session. Entertainment provided by the Temple U. Socialists-Feminists, radical leftists. AFP chose to tour Pennsylvania due to the state’s history in the energy field and their vast resources of shale, crude oil, and coal. This is an opportunity for students to learn about how the left’s radical environmentalist agenda is harming America.
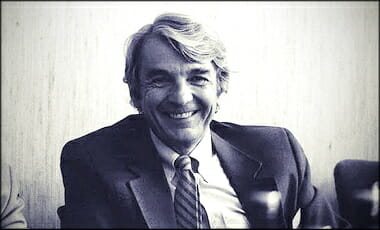
(Above video description) Former Energy Department Undersecretary Steven Koonin on how bureaucrats spin scientific data.
Former Energy Department Undersecretary Steven Koonin told The Wall Street Journal Monday that bureaucrats within former President Barack Obama’s administration spun scientific data to manipulate public opinion.
“What you saw coming out of the press releases about climate data, climate analysis, was, I’d say, misleading, sometimes just wrong,” Koonin said, referring to elements within the Obama administration he said were responsible for manipulating climate data.
He pointed to a National Climate Assessment in 2014 showing hurricane activity has increased from 1980 as an illustration of how federal agencies fudged climate data. Koonin said the NCA’s assessment was technically incorrect.
“What they forgot to tell you, and you don’t know until you read all the way into the fine print is that it actually decreased in the decades before that,” he said.
Levin was responding to a report by The Daily Caller‘s Chris White, who highlighted an admission by a former Obama Energy Department official earlier in the week that the administration deliberately presented “misleading” and “sometimes just wrong” climate data. Here’s an excerpt from the report (second hyperlink added): AUDIO IS GONE :cry: The original article is HERE!
“We are very far from the knowledge needed to make good climate policy,” writes leading scientist Steven E. Koonin
The idea that “Climate science is settled” runs through today’s popular and policy discussions. Unfortunately, that claim is misguided. It has not only distorted our public and policy debates on issues related to energy, greenhouse-gas emissions and the environment. But it also has inhibited the scientific and policy discussions that we need to have about our climate future.
My training as a computational physicist—together with a 40-year career of scientific research, advising and management in academia, government and the private sector—has afforded me an extended, up-close perspective on climate science. Detailed technical discussions during the past year with leading climate scientists have given me an even better sense of what we know, and don’t know, about climate. I have come to appreciate the daunting scientific challenge of answering the questions that policy makers and the public are asking.
The crucial scientific question for policy isn’t whether the climate is changing. That is a settled matter: The climate has always changed and always will. Geological and historical records show the occurrence of major climate shifts, sometimes over only a few decades. We know, for instance, that during the 20th century the Earth’s global average surface temperature rose 1.4 degrees Fahrenheit.
Nor is the crucial question whether humans are influencing the climate. That is no hoax: There is little doubt in the scientific community that continually growing amounts of greenhouse gases in the atmosphere, due largely to carbon-dioxide emissions from the conventional use of fossil fuels, are influencing the climate. There is also little doubt that the carbon dioxide will persist in the atmosphere for several centuries. The impact today of human activity appears to be comparable to the intrinsic, natural variability of the climate system itself.
Rather, the crucial, unsettled scientific question for policy is, “How will the climate change over the next century under both natural and human influences?” Answers to that question at the global and regional levels, as well as to equally complex questions of how ecosystems and human activities will be affected, should inform our choices about energy and infrastructure.
But—here’s the catch—those questions are the hardest ones to answer. They challenge, in a fundamental way, what science can tell us about future climates.
Even though human influences could have serious consequences for the climate, they are physically small in relation to the climate system as a whole. For example, human additions to carbon dioxide in the atmosphere by the middle of the 21st century are expected to directly shift the atmosphere’s natural greenhouse effect by only 1% to 2%. Since the climate system is highly variable on its own, that smallness sets a very high bar for confidently projecting the consequences of human influences.
[….]
We often hear that there is a “scientific consensus” about climate change. But as far as the computer models go, there isn’t a useful consensus at the level of detail relevant to assessing human influences.
[….]
Any serious discussion of the changing climate must begin by acknowledging not only the scientific certainties but also the uncertainties, especially in projecting the future. Recognizing those limits, rather than ignoring them, will lead to a more sober and ultimately more productive discussion of climate change and climate policies. To do otherwise is a great disservice to climate science itself.
I Call B.S. for ALL the people that say this Oroville dam thingy is proof in some way of Climate Disruption (previously Climate Change, and Global Warming before that)! They are right though, Jerry Brown and the Democrats have spent sick money on dumb stuff rather than California’s infrastructure. Governor Brown — contrary to the excerpt from the article — didn’t follow his own advice:
“This matter needs to be investigated from top to bottom,” Alpert said. He said he finds it astounding that even as Gov. Jerry Brown has repeatedly touted preparedness for climate change, officials who manage the dam and other pieces of the state’s water system have “essentially ignored what the governor said was critical for the state of California – and they were allowed to do it.” — THE DESERT SUN
We have had 200-year long droughts, and worse rain (below)… when BIG-OIL didn’t exist. Are “warmists” this dumb? (Yes… the answer is yes.) How bout California — via the Democrats — stop spending money on dumb shite and prepare for what man is not causing… weather:
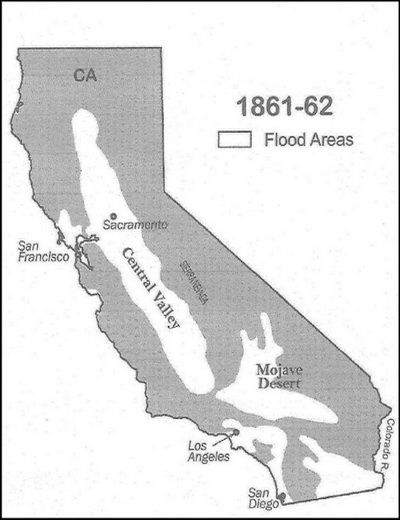
This event is known as “The Great Flood of 1862,” and can happen again… the above is a picture from Sacramento in 1862.
The Great Flood of 1862 was the largest flood in the recorded history of Oregon, Nevada, and California, occurring from December 1861 to January 1862. It was preceded by weeks of continuous rains and snows in the very high elevations that began in Oregon in November 1861 and continued into January 1862. This was followed by a record amount of rain from January 9–12, and contributed to a flood that extended from the Columbia River southward in western Oregon, and through California to San Diego, and extended as far inland as Idaho in the Washington Territory, Nevada and Utah in the Utah Territory, and Arizona in the western New Mexico Territory. Immense snowfalls in the mountains of the far western United States caused more flooding in Idaho, Arizona, New Mexico, and Sonora, Mexico the following spring and summer as the snow melted.
The event was capped by a warm intense storm that melted the high snow load. The resulting snow-melt flooded valleys, inundated or swept away towns, mills, dams, flumes, houses, fences, and domestic animals, and ruined fields.
WATTS UP WITH THAT has a story on this historical period in our past with the article starting out thus:
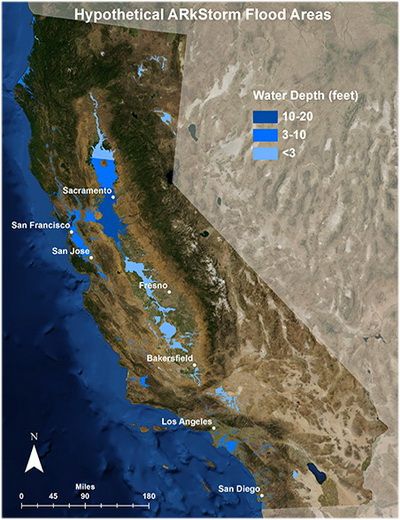
Summary: To boost our fear, activists and journalists report the weather with amnesia about the past. Ten year records become astonishing events; weather catastrophes of 50 or 100 years ago are forgotten. It makes for good clickbait but cripples our ability to prepare for the inevitable. California’s history of floods and droughts gives a fine example — if we listen to the US Geological Survey’s reminder of past megafloods, and their warning of the coming ARkStorm.
“A 43-day storm that began in December 1861 put central and southern California underwater for up to six months, and it could happen again.”
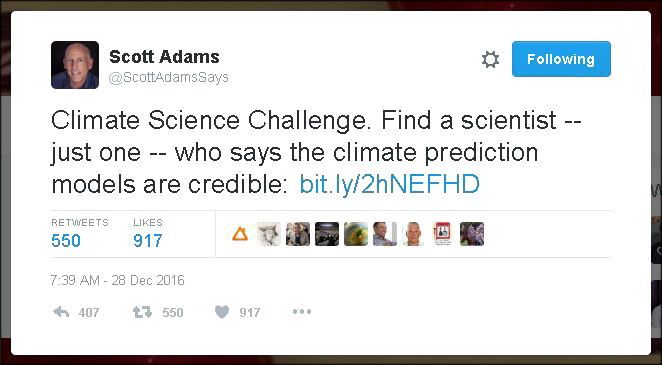
(H-T WUWT) Scott Adams, author of the famous Dilbert Cartoon, has challenged readers to find a qualified scientist who thinks climate models do a good job of predicting the future.
Here is Scott’s Tweet:
The following video presentation is by Patrick Frank, a Ph.D. chemist with more than 50 peer-reviewed articles. He has previously published in Skeptic on the noble savage myth, as well as in Theology and Science on the designer universe myth and in Free Inquiry, with Thomas H. Ray, on the science is philosophy myth. He works [worked?] at Stanford as a Life Science Research Assistant for the Stanford Linear Accelerator Center. His article the video is based on is this:
This may come as a shocker to some, but scientists are not always right — especially when under intense public pressure for answers.
Researchers with the IUCN Polar Bear Specialist Group (PBSG) recently admitted to experienced zoologist and polar bear specialist Susan Crockford that the estimate given for the total number of polar bars in the Arctic was “simply a qualified guess given to satisfy public demand.”
Crockford has been critical of official polar bear population estimates because they fail to include five large subpopulations of polar bears. Due to the uncertainty of the populations in these areas, PBSG did not include them in their official estimate — but the polar bear group did include other subpopulation estimates.
PBSG has for years said that global polar bear populations were between 20,000 and 25,000, but these estimates are likely much lower than how many polar bears are actually living in the world.
“Based on previous PBSG estimates and other research reports, it appears there are probably at least another 6,000 or so bears living in these regions and perhaps as many as 9,000 (or more) that are not included in any PBSG ‘global population estimate,’” Crockford wrote on her blog.
[….]
PBSG disclosed this information to Crockford ahead of the release of their Circumpolar Polar Bear Action Plan in which they intend to put a footnote explaining why their global population estimate is flawed.
“As part of past status reports, the PBSG has traditionally estimated a range for the total number of polar bears in the circumpolar Arctic,” PBSG says in its proposed footnote. “Since 2005, this range has been 20-25,000. It is important to realize that this range never has been an estimate of total abundance in a scientific sense, but simply a qualified guess given to satisfy public demand.”
“It is also important to note that even though we have scientifically valid estimates for a majority of the subpopulations, some are dated,” PBSG continues. “Furthermore, there are no abundance estimates for the Arctic Basin, East Greenland, and the Russian subpopulations.”
“Consequently, there is either no, or only rudimentary, knowledge to support guesses about the possible abundance of polar bears in approximately half the areas they occupy,” says PBSG. “Thus, the range given for total global population should be viewed with great caution as it cannot be used to assess population trend over the long term.”
PBSG’s admission also comes after academics and government regulators have touted their polar bear population estimates to show that polar bear numbers have grown since the 1960s. PBSG estimates have also been used to show that polar bear populations have stabilized over the last 30 years.
Polar bear populations became the centerpiece of the effort to fight global warming due to claims that melting polar ice caps would cause the bears to become endangered in the near future. Years ago, some scientists predicted the Arctic would be virtually ice free by now.
Polar bears became the first species listed under the Endangered Species Act because they could potentially be harmed by global warming. But some recent studies have found that some polar bear subpopulations have actually flourished in recent years.
“So, the global estimates were… ‘simply a qualified guess given to satisfy public demand’ and according to this statement, were never meant to be considered scientific estimates, despite what they were called, the scientific group that issued them, and how they were used,” Crockford said….
A polar-bear expert (researcher and zoologist) refutes FactCheck.org’s article continuing to tell the lie that polar bears are endangered. The article is titled over at Climate Depot as, “Polar Bear Expert refutes warmist Factcheck.org’s claims on on polar bears.” The actual article title is: Challenging Alaska polar bear research sound bites and bewildering ESA status.
It’s easy to take polar bear research papers at face value but it’s not very scientific. The snappy sound bites provided for the benefit of the media – whether they’re embedded in press releases or in published abstracts – don’t cut it with trained scientists. Trained scientists read the whole report, critically examine the evidence it contains and assess that evidence within the context of previous knowledge. That’s what they are trained to do.
I challenge the superficial summary on the status of Alaskan polar bear populations provided by FactCheck.org journalist Vanessa Schipani. Schipani disputed a comment made by Alaska Senator Lisa Murkowski that, according to the latest research Alaskan polar bear population numbers are strong and healthy. I’m not especially interested in the political context of the statement, only Schipani’s bald claim that Murkowski’s declaration is false.
[….]
Insisting that because the ESA and the IUCN Red List consider polar bears threatened with extinction means polar bear populations currently must be population deficient is false and misleading – the statuses of ‘threatened’ and ‘vulnerable’ for polar bears are based on concerns of possible future declines only.
It is factually correct to say that present populations of polar bears in Alaska are healthy. Scientific studies on polar bears – when all of the data is taken into account and considered in the context of all research on these bears – indicates this statement is true.
All of the evidence suggests Southern Beaufort Sea polar bears have recovered from a known and predictable decline in numbers in the mid-2000s due to natural causes – designating “critical habitat” along the Alaska coast will not protect the bears from repeats of this natural hazard in the future – and Chukchi Sea bears have all the indicators of a stable or increasing population. Those are the scientific facts.
(read it all if you dare!)
Here are 5 or the 10 failed predictions regarding Polar Bears via What’s Up With That?
Prediction 1.Western Hudson Bay (WHB) polar bear numbers will continue to declinebeyond 2004 due to ever-earlier breakup and ever-later freeze-up of sea ice.
FAIL – An aerial survey conducted by Seth Stapleton and colleagues (2014) in 2011 produced an estimate of about 1030 bears and their report stated:
“This figure is similar to a 2004 mark–recapture estimate but higher than projections indicating declining abundance since then.”
This 1030 figure is the one being used by the IUCN PBSG and Environment Canada for WHB, as a limited mark-recapture studyconducted the same year (Lunn and colleagues 2014) did not survey the entire WHB region and therefore not comparable to the 2004 count.
Prediction 2. Breakup of sea ice in Western Hudson Bay (WHB) will come progressively earlier and freeze-up dates progressively later (after 1999), as CO2 levels from burning fossil fuel increase global temperatures.
FAIL – Researchers Nick Lunn and colleagues (2014) determined thatthere has been no trend in breakup or freeze-up dates between 2001 and 2010. While no analyses of breakup or freeze-up dates for WHB since 2010 have been published, this pattern seems to havecontinued to at least 2015.
Prediction 3. Chukchi Sea polar bears will be the most harmed by summer sea ice declines because they experience some of the largest sea ice losses of any subpopulation (and thus, the longest open-water season each year).
FAIL – A recent study of Chukchi bears (2008-2011) found them in better condition than they were in the 1980s when summer open-water seasons were short – indeed, only Foxe Basin bears were fatter than Chukchi bears. They were also reproducing well (Rode et al. 2010, 2013, 2014), with some females raising litters of triplets (see lead photo), a rare sight outside Western Hudson Bay.
Prediction 4. Cannibalism will increase as summer sea ice extent declines worsen.
FAIL – Cannibalism is a natural phenomenon in polar bears and none of the few incidents reported recently have involved obviously thin or starving polar bears(even the most recent example, filmed in mid-August 2015 in Baffin Bay when sea ice levels in the region were high),despite the fact that 2012 recorded the lowest summer ice extent since 1979. Incidents of cannibalism cannot be said to be increasingbecause there is no scientific baseline to which recent occurrences can be compared.
Prediction 5.Drowning deaths of polar bears will increase as summer sea ice continues to decline (driven home by a high-profile incident in 2004).
FAIL – There have been no further confirmed reports of polar bear drowning deathsassociated with extensive open water swimming since that contentious 2004 event, even though the two lowest extents of summer sea ice have occurred since then (2007 and 2012). A more rigorous study of swimming prowess found polar bears, including cubs, are capable of successfully making long-distance swims. Indeed, challenging open-water swims don’t happen only in summer: in late March 2015, a polar bear swam through open water from the pack ice off Newfoundland to the Hibernia oil platform well offshore.
Guest essay by Dr. Susan J. Crockford of polarbearscience.com * see update below on the % number
Survey Results: Svalbard polar bear numbers increased 30 42% over last 11 years
Results of this fall’s Barents Sea population survey have been released by the Norwegian Polar Institute and they are phenomenal: despite several years with poor ice conditions, there are more bears now (~975) than there were in 2004 (~685) around Svalbard (a 30 42% increase) and the bears were in good condition.
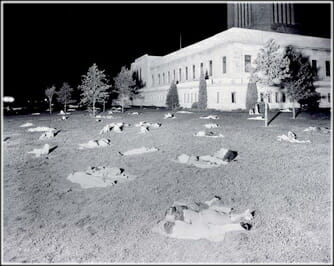
During the great heatwave of July, 2016 – temperatures in Ada, Minnesota averaged 16 degrees cooler than during July, 1936… Aurora, Illinois was about 13 degrees warmer in 1936… Same story in Bloomington, Indiana. (The Deplorable Climate Science Blog)
Residents of Lincoln, Nebraska spend the night on the lawn of the state capital on July 25, 1936. The temperature that night never fell below 91°, perhaps the warmest night ever recorded anywhere in the United States outside of the desert Southwest.
NOAA has found it necessary to monkey with July temperatures by 1,000% in order to note that 2016 is the hottest July on record. (Ditto)
In 1924 the outback Australian town of Marble Bar recorded the longest ever heatwave, setting a record for the most consecutive days above 100F (37.8C). In 1976 the United Kingdom sweltered in temperatures exceeding 90F (32.2C) for 15 consecutive days. A further five days saw temperatures reaching 95F (35C). Parts of the country’s southwest went for 45 days without rain, prompting terrible heath and forest fires that destroyed trees and crops. The heatwave came to a dramatic end in August, with severe thunderstorms rolling across the country.
More accurate measurements of the lower troposphere show that July was nowhere near as warm as 1998 and 2010.
This is why REAL SCIENCE notes that for Gavin A. Schmidt (of NASA) to say July is the hottest month on record is this most PROVABLY fraudulent statement yet.
The touting of all these “hottest years” and scare tactics and the U.N. saying rising oceans will threaten the Statue of Liberty, are all power grabs. Period. The EPA says their most strict legislative acts to implement new regulations that will fight global warming, are ALSO A LIE! Like the Arctic for years being prophesied to be ice-free, and in fact setting ice-expansion records during month it was suppose to be ice-free.
Environmental Protection Agency Administrator Gina McCarthy admitted her agency’s signature regulation aimed at tackling global warming was meant to show “leadership” rather than actually curb projected warming.
McCarthy admitted as much after being questioned by West Virginia Republican Rep. David McKinley, who pressed the EPA chief on why the Obama administration was moving forward with economically-damaging regulations that do nothing for the environment.
“I don’t understand,” McKinley said in a Tuesday hearing. “If it doesn’t have an impact on climate change around the world, why are we subjecting our hard working taxpayers and men and women in the coal fields to something that has no benefit?”…
Here is a great presentation showing the EPA to be full of B.S. Former Obama Department of Energy Assistant Secretary Charles McConnell eviscerates the President’s proposed Clean Power Plan regulation to fight global warming in testimony before Congress:
I said out-loud “AMEN” to the line, “I am no lawyer, but I AM a citizen!”
This video is based on David E.W. Evans work over at MISES DAILY…
We check the main predictions of the climate models against the best and latest data. Fortunately the climate models got all their major predictions wrong. Why? Every serious skeptical scientist has been consistently saying essentially the same thing for over 20 years, yet most people have never heard the message. Here it is, put simply enough for any lay reader willing to pay attention.
(BIO) Dr. David M.W. Evans consulted full time for the Australian Greenhouse Office (now the Department of Climate Change) from 1999 to 2005, and part time 2008 to 2010, modeling Australia’s carbon in plants, debris, mulch, soils, and forestry and agricultural products. Evans is a mathematician and engineer, with six university degrees including a PhD from Stanford University in electrical engineering. The area of human endeavor with the most experience and sophistication in dealing with feedbacks and analyzing complex systems is electrical engineering, and the most crucial and disputed aspects of understanding the climate system are the feedbacks. The evidence supporting the idea that CO2 emissions were the main cause of global warming reversed itself from 1998 to 2006, causing Evans to move from being a warmist to a skeptic.
“The scientist behind the bogus claim in a Nobel Prize-winning UN report that Himalayan glaciers will have melted by 2035 last night admitted it was included purely to put political pressure on world leaders…. Dr. Lal’s admission will only add to the mounting furor over the melting glaciers assertion, which the IPCC was last week forced to withdraw because it has no scientific foundation.” (David Rose, The Daily Mail, January 24, 2010)
David Mamet, The Secret Knowledge: On the Dismantling of American Culture (New York, NY: Sentinel Publishing, 2011), [FN] 161.
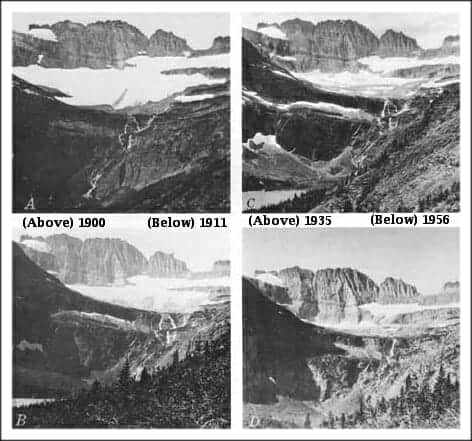
“Shrinking Glaciers – In 2013, an iceberg larger than the city of Chicago broke off the Pine Island Glacier, the most important glacier of the West Antarctic Ice Sheet. And at Montana’s Glacier National Park glaciers have gone from 150 to just 35 over the past century.”
Response:
Calling attention to anecdotal incidents of icebergs breaking off the Antarctic ice sheet, while deliberately ignoring the overall growth of the Antarctic ice sheet, is a misleading and favorite tactic of global warming alarmists. Icebergs break off the Antarctic ice sheet every year, with or without global warming, particularly in the Antarctic summer. However, a particular iceberg – no matter how large – breaking off the Antarctic ice sheet does not necessarily result in “Shrinking Glaciers” as EDF alleges. To the contrary, the Antarctic Ice Sheet has been growing at a steady and substantial pace ever since NASA satellites first began measuring the Antarctic ice sheet in 1979. Indeed, during the same year that the EDF claims “an iceberg larger than the city of Chicago” broke off the Antarctic ice sheet and caused “Shrinking Glaciers,” the Antarctic ice sheet repeatedly set new records for its largest extent in recorded history. Those 2013 records were repeatedly broken again in 2014. The Antarctic ice sheet in 2013 and 2014 was more extensive than any time in recorded history, and yet the EDF pushes the lie that the Antarctic Ice Sheet is shrinking.
The EDF’s assertion about Glacier National Park is also misleading. Alpine glaciers at Glacier National Park and elsewhere have been receding for over 300 years, since the Earth’s temperature bottomed out during the depths of the Little Ice Age. The warming of the past 300 years and the resulting recession of alpine glaciers predated humans building coal-fired power plants and driving SUVs. Moreover, opening up more of the Earth’s surface to vegetation and plant and animal life would normally be considered a beneficial change, if global warming alarmists had not so thoroughly politicized the global warming discussion.
Hockey Schtick piles on with this historical look back on Glacier National Park:
A new paper published in Quaternary Science Reviews finds that alpine glaciers in Glacier National Park, Montana retreated up to 6 times faster during the 1930’s and 1940’s than over the past 40 years. The “Multi-proxy study of sediment cores retrieved from lakes below modern glaciers supports the first detailed Neoglacial chronology for Glacier National Park (GNP)” and shows “maximum reconstructed retreat rates [in] 1930” of about 125 meters per year, compared to near zero in ~1975 and about 20 meters/year at the end of the record in ~2005. The authors report, “Results indicate that alpine glaciers in Glacier National Park advanced and retreated numerous times during the Holocene after the onset of Neoglaciation 6,500 years before the present” and “Retreat from the Little Ice Age maximum was the most dramatic episode of ice retreat in at least the last 1000 years.”
Some more in-depth studies on Glacier National Park detailing the rapid recession before man started to insert in earnest CO2 into the atmosphere can be found here:
Testimony of Dr. Syun-Ichi Akasofu before the united states senate committee on commerce (PDF)… (BIO — Dr. Akasofu is the founding director of the International Arctic Research Center of the University of Alaska Fairbanks, serving in that position from the center’s establishment in 1998 until January 2007.)
A lacustrine-based Neoglacial record for Glacier National Park, Montana, USA (PEER REVIEWED)
Another blow to the glacier myth comes from WATTS UP WITH THAT and notes that the “receding Swiss glaciers inconveniently reveal 4000 year old forests – and make it clear that glacier retreat is nothing new,” …continuing:
Dr. Christian Schlüchter’s discovery of 4,000-year-old chunks of wood at the leading edge of a Swiss glacier was clearly not cheered by many members of the global warming doom-and-gloom science orthodoxy.
This finding indicated that the Alps were pretty nearly glacier-free at that time, disproving accepted theories that they only began retreating after the end of the little ice age in the mid-19th century. As he concluded, the region had once been much warmer than today, with “a wild landscape and wide flowing river.”….
…Other evidence exists that there is really nothing new about dramatic glacier advances and retreats. In fact the Alps were nearly glacier-free again about 2,000 years ago. Schlüchter points out that “the forest line was much higher than it is today; there were hardly any glaciers. Nowhere in the detailed travel accounts from Roman times are glaciers mentioned.”
Schlüchter criticizes his critics for focusing on a time period which is “indeed too short.” His studies and analyses of a Rhone glacier area reveal that “the rock surface had [previously] been ice-free 5,800 of the last 10,000 years.”
Such changes can occur very rapidly. His research team was stunned to find trunks of huge trees near the edge of Mont Miné Glacier which had all died in just a single year. They determined that time to be 8,200 years ago based upon oxygen isotopes in the Greenland ice which showed marked cooling.
Casting serious doubt upon alarmist U.N.-IPCC projections that the Alps will be nearly glacier-free by 2100, Schlüchter poses several challenging questions: “Why did the glaciers retreat in the middle of the 19th century, although the large CO2 increase in the atmosphere came later? Why did the Earth ‘tip’ in such a short time into a warming phase? Why did glaciers again advance in the 1880s, 1920s, and 1980s? . . . Sooner or later climate science will have to answer the question why the retreat of the glacier at the end of the Little Ice Age around 1850 was so rapid.”
Although we witness ongoing IPCC attempts to blame such developments upon evil fossil-fueled CO2 emissions, that notion fails to answer these questions. Instead, Schlüchter believes that the sun is the principal long-term driver of climate change, with tectonics and volcanoes acting as significant contributors….
Regarding IPCC integrity with strong suspicion, Schlüchter recounts a meeting in England that he was “accidentally” invited to which was led by “someone of the East Anglia Climate Center who had come under fire in the wake of the Climategate e-mails.”
As he describes it: “The leader of the meeting spoke like some kind of Father. He was seated at a table in front of those gathered and he took messages. He commented on them either benevolently or dismissively.”
“The idea that ‘Climate science is settled’ runs through today’s popular and policy discussions. Unfortunately, that claim is misguided. It has not only distorted our public and policy debates on issues related to energy, greenhouse-gas emissions and the environment. But it also has inhibited the scientific and policy discussions that we need to have about our climate future.” ~ Steven E. Koonin, Undersecretary of Energy for Science under Obama.
My resource on throwing deniers in jail is the best online:
A great site bringing together the professional as well as the media’s critique of the 97% consensus can be found HERE: 97 Articles Refuting The “97% Consensus” This really the bottom line:
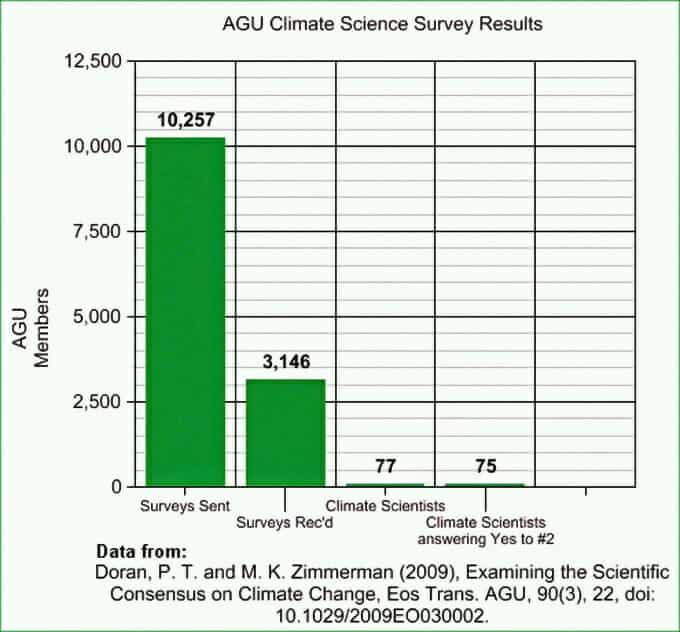
…The “97 percent” figure in the Zimmerman/Doran survey represents the views of only 79 respondents who listed climate science as an area of expertise and said they published more than half of their recent peer-reviewed papers on climate change. Seventy-nine scientists—of the 3,146 who responded to the survey—does not a consensus make.
In 2010, William R. Love Anderegg, then a student at Stanford University, used Google Scholar to identify the views of the most prolific writers on climate change. His findingswere published in Proceedings of the National Academies of Sciences. Mr. Love Anderegg found that 97% to 98% of the 200 most prolific writers on climate change believe “anthropogenic greenhouse gases have been responsible for ‘most’ of the ‘unequivocal’ warming.” There was no mention of how dangerous this climate change might be; and, of course, 200 researchers out of the thousands who have contributed to the climate science debate is not evidence of consensus.
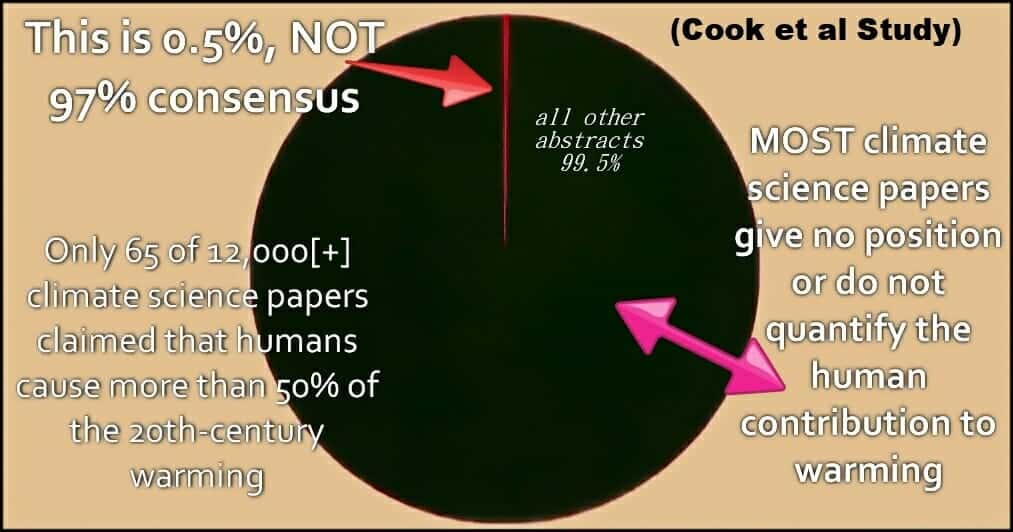
In 2013, John Cook, an Australia-based blogger, and some of his friends reviewed abstracts of peer-reviewed papers published from 1991 to 2011. Mr. Cook reported that 97% of those who stated a position explicitly or implicitly suggest that human activity is responsible for some warming. His findings were published in Environmental Research Letters.
Mr. Cook’s work was quickly debunked. In Science and Education in August 2013, for example, David R. Legates (a professor of geography at the University of Delaware and former director of its Center for Climatic Research) and three coauthors reviewed the same papers as did Mr. Cook and found “only 41 papers—0.3 percent of all 11,944 abstracts or 1.0 percent of the 4,014 expressing an opinion, and not 97.1 percent—had been found to endorse” the claim that human activity is causing most of the current warming. Elsewhere, climate scientists including Craig Idso, Nicola Scafetta, Nir J. Shavivand Nils- Axel Morner, whose research questions the alleged consensus, protested that Mr. Cook ignored or misrepresented their work.
Rigorous international surveys conducted by German scientists Dennis Bray and Hans von Storch—most recently published in Environmental Science & Policy in 2010—have found that most climate scientists disagree with the consensus on key issues such as the reliability of climate data and computer models. They do not believe that climate processes such as cloud formation and precipitation are sufficiently understood to predict future climate change.
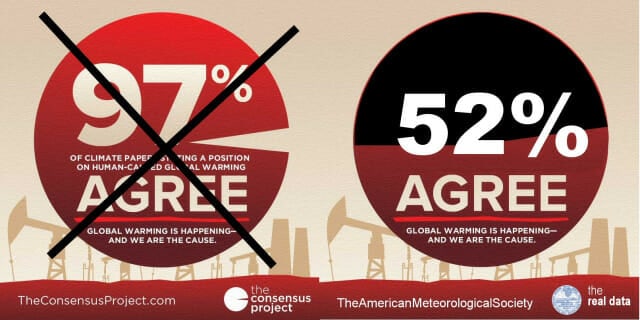
Surveys of meteorologists repeatedly find a majority oppose the alleged consensus. Only 39.5% of 1,854 American Meteorological Society members who responded to a survey in 2012 said man-made global warming is dangerous.
Finally, the U.N.’s Intergovernmental Panel on Climate Change—which claims to speak for more than 2,500 scientists—is probably the most frequently cited source for the consensus. Its latest report claims that “human interference with the climate system is occurring, and climate change poses risks for human and natural systems.” Yet relatively few have either written on or reviewed research having to do with the key question: How much of the temperature increase and other climate changes observed in the 20th century was caused by man-made greenhouse-gas emissions? The IPCC lists only 41 authors and editors of the relevant chapter of the Fifth Assessment Report addressing “anthropogenic and natural radiative forcing.”…
Cook misquoted papers (the one’s he included… not the 8,000 he excluded) as representing consensus… the original post by Popular Technology is HERE, but FORBES did a good job on explaining the discrepancies as stated by the “consensus scientists/specialists.”
…When Popular Technology asked physicist Nicola Scafetta whether Cook and his colleagues accurately classified one of his peer-reviewed papers as supporting the ‘consensus’ position, Scafetta similarly criticized the Skeptical Science classification.
“Cook et al. (2013) is based on a straw man argument because it does not correctly define the IPCC AGW theory, which is NOT that human emissions have contributed 50%+ of the global warming since 1900 but that almost 90-100% of the observed global warming was induced by human emission,” Scafetta responded. “What my papers say is that the IPCC [United Nations Intergovernmental Panel on Climate Change] view is erroneous because about 40-70% of the global warming observed from 1900 to 2000 was induced by the sun.”
“What it is observed right now is utter dishonesty by the IPCC advocates. … They are gradually engaging into a metamorphosis process to save face. … And in this way they will get the credit that they do not merit, and continue in defaming critics like me that actually demonstrated such a fact since 2005/2006,” Scafetta added.
Astrophysicist Nir Shaviv similarly objected to Cook and colleagues claiming he explicitly supported the ‘consensus’ position about human-induced global warming. Asked if Cook and colleagues accurately represented his paper, Shaviv responded, “Nope… it is not an accurate representation. The paper shows that if cosmic rays are included in empirical climate sensitivity analyses, then one finds that different time scales consistently give a low climate sensitivity. i.e., it supports the idea that cosmic rays affect the climate and that climate sensitivity is low. This means that part of the 20th century [warming] should be attributed to the increased solar activity and that 21st century warming under a business as usual scenario should be low (about 1°C).”
“I couldn’t write these things more explicitly in the paper because of the refereeing, however, you don’t have to be a genius to reach these conclusions from the paper,” Shaviv added.
To manufacture their misleading asserted consensus, Cook and his colleagues also misclassified various papers as taking “no position” on human-caused global warming. When Cook and his colleagues determined a paper took no position on the issue, they simply pretended, for the purpose of their 97-percent claim, that the paper did not exist.
Morner, a sea level scientist, told Popular Technology that Cook classifying one of his papers as “no position” was “Certainly not correct and certainly misleading. The paper is strongly against AGW [anthropogenic global warming], and documents its absence in the sea level observational facts. Also, it invalidates the mode of sea level handling by the IPCC.”
Soon, an astrophysicist, similarly objected to Cook classifying his paper as “no position.”
“I am sure that this rating of no position on AGW by CO2 is nowhere accurate nor correct,” said Soon.
“I hope my scientific views and conclusions are clear to anyone that will spend time reading our papers. Cook et al. (2013) is not the study to read if you want to find out about what we say and conclude in our own scientific works,” Soon emphasized…
Here are some visuals… and note that if 75 climatologists are a consensus, or 0.5% is a consensus, then how bout this very short list of specialists rejecting the issue in some form… what kind of consensus is that?
I bet many make the point that these specialists do not count. Let me get this straight… they counted when used to promote consensus but do not now that they say their works were misquoted/misused? Forbes and the Wall Street Journal or leading climatologists/physicists (like top-notch persons in their field like Richard Lindzen or Freeman Dyson as examples — or these 1,000 scientists, or these 3,805 scientists trained in specialties directly related to the physical environment of the Earth and the past and current phenomena that affect that environment and 5,812 scientists trained in the fundamental physical and molecular properties of gases, liquids, and solid, which are essential to understanding the physical properties of the atmosphere and Earth.) aren’t enough… how bout this PEER REVIEWED PAPER delving into the consensus in an in-depth manner. Here is the abstract… followed by some visuals:
Agnotology is the study of how ignorance arises via circulation of misinformation calculated to mislead. Legates et al. (Sci Educ 22:2007–2017, 2013) had questioned the applicability of agnotology to politically-charged debates. In their reply, Bedford and Cook (Sci Educ 22:2019–2030, 2013), seeking to apply agnotology to climate science, asserted that fossil-fuel interests had promoted doubt about a climate consensus. Their definition of climate ‘misinformation’ was contingent upon the post-modernist assumptions that scientific truth is discernible by measuring a consensus among experts, and that a near unanimous consensus exists. However, inspection of a claim by Cook et al. (Environ Res Lett 8:024024, 2013) of 97.1 % consensus, heavily relied upon by Bedford and Cook, shows just 0.3 % endorsement of the standard definition of consensus: that most warming since 1950 is anthropogenic. Agnotology, then, is a two-edged sword since either side in a debate may claim that general ignorance arises from misinformation allegedly circulated by the other. Significant questions about anthropogenic influences on climate remain. Therefore, Legates et al. appropriately asserted that partisan presentations of controversies stifle debate and have no place in education.
Continuing…
He mentioned most of the experts KNOW how CO2 affects climate. He says he does not and doesn’t think they do either. This has nothing to do with the supposed “consensus” of experts — 97% — who “say” it is driven by mankind. This is known as anthropogenic global warming, of AGW. The myth of the 97% started with ONLY 75-out-of-77 climatologists saying they believe man is the primary cause.
Yes, you heard me correctly, seventy-five.
Another study has undergrads and non-specialists (bloggers) search through many articles in peer reviewed journals, and noting that a large majority supported the AGW position. The problem was that they were not specialized in the field of science… AND… they only read the abstracts, not the peer reviewed paper itself. Many of the scientists behind the papers “said” to support AGW rejected that idea. So the specialists THEMSELVES said their papers cannot be read to support the AGW position.
Another study (pictured in the graph above) tries to save an earlier one with tainted information based on abstracts — a very UNSCIENTIFIC way to get to consensus (that is, relying on abstracts). Not only was this study based on abstracts, again, non specialists categorized them. Yet another study was merely based on search parameters/results. Here is more info (mainly links) for the not-faint-of-heart.
In reality, nearly half of specialists in the fields related reject man causing climates change.
And a good portion of those that do reject the claim that it is detrimental to our planet.
Only 13% saw relatively little danger (ratings of 1 to 3 on a 10-point scale); the rest were about evenly split between the 44% who see moderate to high danger (ratings of 4 to 7) and 41% who see very high or grave danger (ratings of 8 to 10). (Forbes)
Here is a list of scientists with varying views on the cause of “Climate Change,” and here is a list of 31,000 who stand against man as the primary cause.
AGAIN, to be clear, and to quote the post by STEVEN CROWDER:
…Also, this is kind of inconvenient, but needs to be said. The “97% of Climate Scientists Agree” meme all the climate-change robots harp on and on about is actually a load of pure organic manure, better left to grow your weed than fuel your global warming climate change passions.
In 2013, John Cook, an Australia-based blogger, and some of his friends reviewed abstracts of peer-reviewed papers published from 1991 to 2011. Mr. Cook reported that 97% of those who stated a position explicitly or implicitly suggest that human activity is responsible for some warming. His findings were published in Environmental Research Letters.
Mr. Cook’s work was quickly debunked. In Science and Education in August 2013, for example, David R. Legates (a professor of geography at the University of Delaware and former director of its Center for Climatic Research) and three coauthors reviewed the same papers as did Mr. Cook and found “only 41 papers—0.3 percent of all 11,944 abstracts or 1.0 percent of the 4,014 expressing an opinion, and not 97.1 percent—had been found to endorse” the claim that human activity is causing most of the current warming. Elsewhere, climate scientists including Craig Idso, Nicola Scafetta, Nir J. Shaviv and Nils- Axel Morner, whose research questions the alleged consensus, protested that Mr. Cook ignored or misrepresented their work.
In other words:
“If you tell a lie big enough and keep repeating it, people will eventually come to believe it. The lie can be maintained only for such time as the State can shield the people from the political, economic and/or military consequences of the lie. It thus becomes vitally important for the State to use all of its powers to repress dissent, for the truth is the mortal enemy of the lie, and thus by extension, the truth is the greatest enemy of the State.” ~ Joseph Goebbels (Adolf Hitler’s Propagandist)
Put that in your hookah and smoke it. Remember that little tidbit when you insist unborn babies are not humans, especially when you refuse to look at any evidence. Tell me again about how much you respect science.
Also good to remember anytime somebody is pushing anything on you? Follow the money. ‘Cause guess what, kids? There’s a lot of money in saying the Earth is warming and it’s totes our fault…
FromThe National Review: In truth, the overwhelming majority of climate-research funding comes from the federal government and left-wing foundations. And while the energy industry funds both sides of the climate debate, the government/foundation monies go only toward research that advances the warming regulatory agenda. With a clear public-policy outcome in mind, the government/foundation gravy train is a much greater threat to scientific integrity.
And here are some more points from Obama’s man:
For the latest IPCC report (September 2013), its Working Group I, which focuses on physical science, uses an ensemble of some 55 different models. Although most of these models are tuned to reproduce the gross features of the Earth’s climate, the marked differences in their details and projections reflect all of the limitations that I have described. For example:
The models differ in their descriptions of the past century’s global average surface temperature by more than three times the entire warming recorded during that time. Such mismatches are also present in many other basic climate factors, including rainfall, which is fundamental to the atmosphere’s energy balance. As a result, the models give widely varying descriptions of the climate’s inner workings. Since they disagree so markedly, no more than one of them can be right.
Although the Earth’s average surface temperature rose sharply by 0.9 degree Fahrenheit during the last quarter of the 20th century, it has increased much more slowly for the past 16 years, even as the human contribution to atmospheric carbon dioxide has risen by some 25%. This surprising fact demonstrates directly that natural influences and variability are powerful enough to counteract the present warming influence exerted by human activity.
Yet the models famously fail to capture this slowing in the temperature rise. Several dozen different explanations for this failure have been offered, with ocean variability most likely playing a major role. But the whole episode continues to highlight the limits of our modeling.
The models roughly describe the shrinking extent of Arctic sea ice observed over the past two decades, but they fail to describe the comparable growth of Antarctic sea ice, which is now at a record high.
The models predict that the lower atmosphere in the tropics will absorb much of the heat of the warming atmosphere. But that “hot spot” has not been confidently observed, casting doubt on our understanding of the crucial feedback of water vapor on temperature.
Even though the human influence on climate was much smaller in the past, the models do not account for the fact that the rate of global sea-level rise 70 years ago was as large as what we observe today—about one foot per century.
A crucial measure of our knowledge of feedbacks is climate sensitivity—that is, the warming induced by a hypothetical doubling of carbon-dioxide concentration. Today’s best estimate of the sensitivity (between 2.7 degrees Fahrenheit and 8.1 degrees Fahrenheit) is no different, and no more certain, than it was 30 years ago. And this is despite an heroic research effort costing billions of dollars.
BREITBART adds to the idea of the “Cooked” Cook paper with a real survey:
Nearly six in ten climate scientists don’t adhere to the so-called “consensus” on man-made climate change, a new study by the Dutch government has found. The results contradict the oft-cited claim that there is a 97 percent consensus amongst climate scientists that humans are responsible for global warming.
The study, by the PBL Netherlands Environment Assessment Agency, a government body, invited 6550 scientists working in climate related fields, including climate physics, climate impact, and mitigation, to take part in a survey on their views of climate science.
Of the 1868 who responded, just 43 percent agreed with the IPCC that “It is extremely likely {95%+ certainty} that more than half of [global warming] from 1951 to 2010 was caused by [human activity]”. Even with the “don’t knows” removed that figure increases only to 47 percent, still leaving a majority of climate scientists who do not subscribe to the IPCC’s statement.
The findings directly contradict the claim that 97 percent of climate scientists endorse the view that humans are responsible for global warming, as first made by Cook et al in a paper published in Environment Research Letters.
Cook’s paper has since been extremely widely debunked, yet so ingrained has the 97 percent consensus claim become that The Guardian has an entire section named after it, and President Obama has cited it on Twitter.
Commenting on the new study, Australian climate blogger Joanne Nova said: “Finally there is a decent survey on the topic, and it shows that less than half of what we would call “climate scientists” who research the topic and for the most part, publish in the peer reviewed literature, would agree with the IPCC’s main conclusions. Only 43% of climate scientists agree with the IPCC “97%” certainty.”…
No matter what you think of the following long and short lists… the bottom line is this, WAY more than 75-Climatologists think that man is either not the main contributor to global warming at all, or that global warming is not a catastrophe waiting to happen:
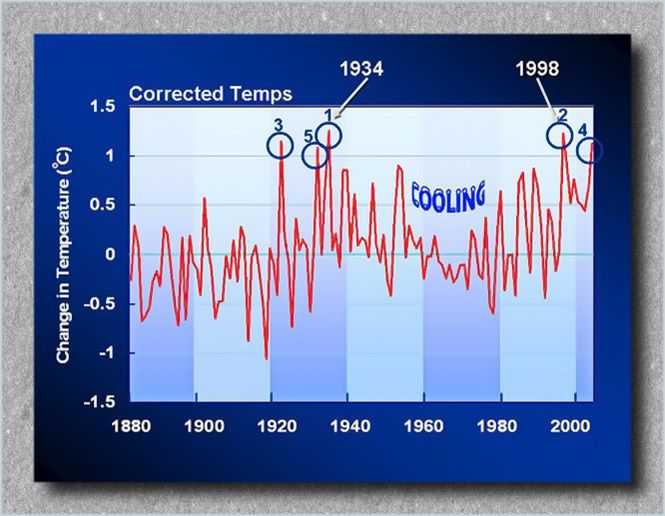
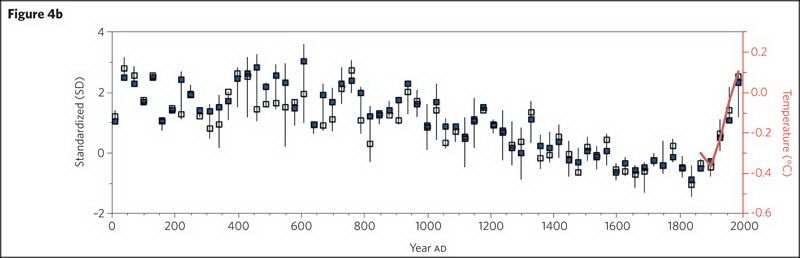
This post will be an extended rebuttal to a portion of a much longer discussion. It is in response to the cartoonists website, SKEPTICAL SCIENCE, which has been responded to in a manner that should undermine it’s validity. But alas, it does not. So first let me post the graphic that caused the person to run to this propaganda site for a rebuttal:
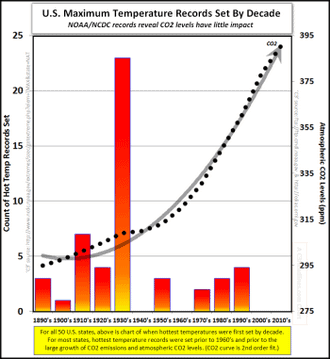
The year 1934 was a very hot year in the United States, ranking fourth behind 2012, 2006, and 1998. However, global warming takes into account temperatures over the entire planet. The U.S.’s land area accounts for only 2% of the earth’s total surface area. Despite the U.S. heat in 1934, the year was not so hot over the rest of the planet, and is barely holding onto a place in the hottest 50 years in the global rankings (today it ranks 49th).
There are some preliminary thoughts on this before we get into the “nitty gritty.” First, in 1933-1936 (the heat wave and wild weather span), how many countries or persons were recording weather and temperature anomalies? Common sense says that of course, not nearly as much as today. We only started measuring with satellites since 1979. Another head-tilter would be have or did the NOAA or NASA previously note other years as warmer — in the past? We will find this out as we go along.
As you read this stuff (follow links to stories, and the like), that some sites just use the basic data without correcting it. I will discuss this later in the post… but first and foremost, are there reports from those years showing temperature and weather anomalies from around the world? Yes. Here is some evidences:
Mind you, this is a small sampling from THE NO TRICKS ZONE, many more examples can be found at C3 HEADLINES, as well as a site documenting the United Kingdom’s weather for some years. So it seems that we are looking at a few year GLOBAL weather pattern. AGAIN, we did not have satellites then so we can rely on eyewitness accounts such as these.
However, I wanted to comment on some of the wrong data being used or fudged data to make climate look worse now than in the past. I have to thank the person I was discussing the issue with, because he had posted a story linked to the journal, Nature. All it had was an abstract, and while I am a member of the AAAS, the Nature journal subscription was too much. There were also a list of corrections, so I asked him for either a full article and/or some links to the corrections. Lo-and-behold he gave me a link of a corrected graph that worked in my favor:
The red area is what concerns me… but even with it is has been warmer in the past (to note the bottom line). A professor at Berkeley notes that there is a collusion between some to hide the data that counters the narrative from the “warmists.” Mind you, the following video is for 2014, but I will make a point afterwords:
MRCTV BLOG notes the following that will throw a stone into the shoe of the left about 2015 being the hottest year. Remember, the internet never forgets!
…To explain where NOAA messed up, we have to start with 1997.
In that 1997 report, they say clearly that the Global Average Temperature (GAT) was 62.45°F, based on a 30-year average (1961-1990) of the combined land and sea surface temperatures. Since we know the 1997 El Nino caused a record high spike in temperature, that means that for that 30 year period, there was no warmer GAT than 62.45°F up until that time.
Now, back to 2015. The recently released NOAA report, claiming that 2015 was the hottest year ever, says:
During 2015, the average temperature across global land and ocean surfaceswas 1.62°F (0.90°C) above the 20th century average. This was the highest among all 136 years in the 1880–2015 record, surpassing the previous record set last year by 0.29°F (0.16°C) and marking the fourth time a global temperature record has been set this century.
It was blogger Wattsupwiththat who first noticed and explained the funky math. He explains that the recent report compares 2015 to the 20th century average – but, doesn’t mention what that average temperature was.
However, it does give a 20th Century average in its November 2015 State of the Climate Report: – 13.9 degrees Celsius (57 degrees Fahrenheit):
Now, it’s math time:
According to NOAA, the global average temperature for the 20th century was 57 degrees Fahrenheit.
And the 2015 average was 1.62 degrees Fahrenheit above that average.
In other words, according to this recent NOAA report, 2015 was the hottest year ever at 58.62 degrees Fahrenheit (57+1.62).
And, that 1997 NOAA report states 1997 had an average global temperature of 62.45 degrees.
….According to my calculator:
1997’s 62.45 degrees is 3.83 degrees Fahrenheit higher than 2015’s 58.62 degrees Fahrenheit, meaning that – using NOAA’s own numbers – 2015 cannot be the hottest year on record.
As suggested monthly by the mainstream media since April 2015, NOAA and NASA officially declared that 2015 surpassed the 2014 record to become the new hottest year on record and that 2016 could be hotter than 2015! The average global temperatures calculated by NOAA and NASA, however, appear to be inaccurate and unreliable for the following reasons:
In Table 2, we’ve compiled the top five years when the most records were set. When multiple years tie for the high, each individual year gets a fraction of a “record”. So, for example, 1954 and 1933 each get a half of a record for Colorado.
According to data on the NOAA website, 1997 was truly the hottest year on record at 62.45 oF. The average global temperature in 2015 was 58.62 oF or 3.83 oF below the 1997 temperature.
According to data on the NOAA website, the temperatures such as the 20th century average temperature and annual temperature anomalies, which must be fixed, have different values in the annual global analyses.
NOAA and NASA corrected historical temperature data and fabricated temperature data in areas without temperature record systematically, widely, and uni-directionally to “cool” the past in an attempt to prove the soaring temperature trend.
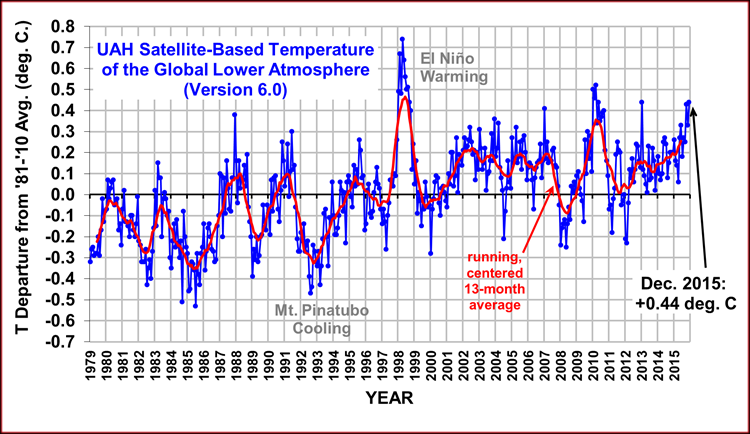
NOAA and NASA made efforts to discredit their own satellite data – which is consistent with the balloon data – because it suggests a global warming hiatus since 1998 contradicting with the NOAA and NASA preferred narrative.
NOAA and NASA refused to give data and information requested by the US House of Representatives Science, Space and Technology committee. There is no reason for them to withhold the data and information, which are public domain, unless they have something to hide.
The headline “last year was the hottest year on record, this year is hotter than last year, and next year could be hotter than this year” is likely to be repeated years after years until funding for climate change is stopped!
The National Center for Policy Analysis, mentions a change a few years back:
The warmest year on record is no longer 1998 and not because it has been overtaken by a recent heat wave. National Aeronautics and Space Administration (NASA) scientist James Hansen’s famous claims about 1998 being the warmest year on record in the United States was the result of a serious math error, according to H. Sterling Burnett, a senior fellow at the National Center for Policy Analysis (NCPA).
According to NASA’s newly published data:
The hottest year on record is 1934, not 1998.
The third hottest year on record was 1921, not 2006.
Three of the five hottest years on record occurred before 1940.
Six of the top 10 hottest years occurred before 90 percent of the growth in greenhouse gas emissions during the last century occurred.
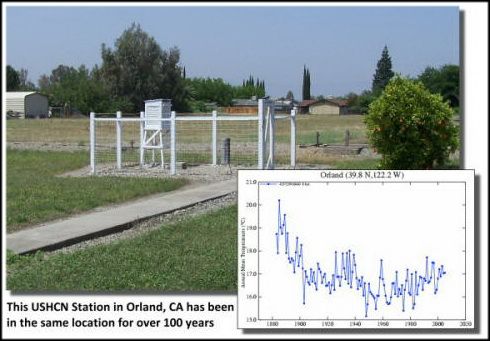
Here we see raw data vs. messaged data run through a hopper. In 2007 NASA adjusted it’s U.S. findings to match the real data:
The measured USHCN daily temperature data shows a decline in US temperatures since the 1930s. But before they release it to the public, they put it thorough a series of adjustments which change it from a cooling trend to a warming trend.
[….]
The next blink comparator shows changes in the US temperature record from GISS. It alternates between their 1999 graph and the 2012 version of the same graph. The past is cooled and the present is warmed.
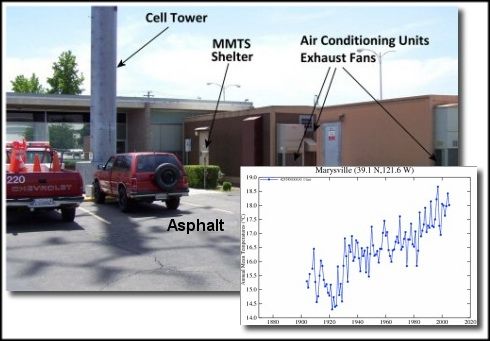
Here are some examples of fudged data because of sub-standard equipment:
You’d think the answer would be obvious, but here we have a NOAA operated USHCN climate station of record providing a live experiment. It always helps to illustrate with photos. Today I surveyed a sewage treatment plant, one of 4 stations surveyed today (though I tried for 5) and found that for convenience, they had made a nice concrete walkway to allow servicing the Fisher-Porter rain gauge, which needs a paper punch tape replaced one a month.
Here is what you see in visible light:
Here is what the infrared camera sees:
Note that the concrete surface is around 22-24°C, while the grassy areas are between 12-19°C
Class 5 (error >~= 5C) – Temperature sensor located next to/above an artificial heating source, such a building, roof top, parking lot, or concrete surface.”
More than half of the stations the NOAA use are tainted or wrongly placed equipment. Here is an example of a well maintained station with data sets:
Here is data sets corresponding to a site where heat corrupts the data:
Here are even more corrupt examples of these stations placed next to air conditioner outlets, next to burners, next to lights that glow at night, asphalt surrounding them and buildings that radiate heat as well as block wind (NOTE this continually growing accumulation of these sites at WUWT):
CHANGING DATA-SETS
Another example of changing averages was noted by Steve Goddard and others — even the NOAA have acknowledge it — have been discussing recently is exemplified in Dr. Judith Carry’s post on the matter (from a larger post of mine):
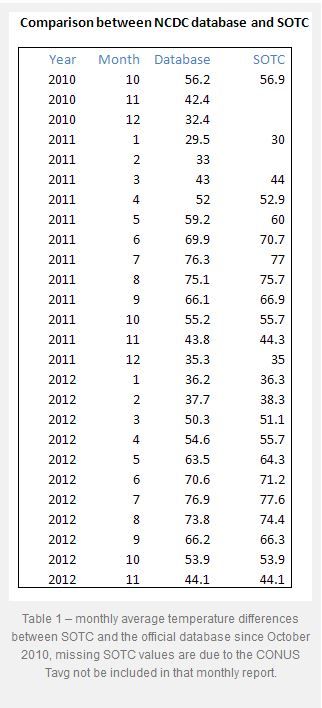
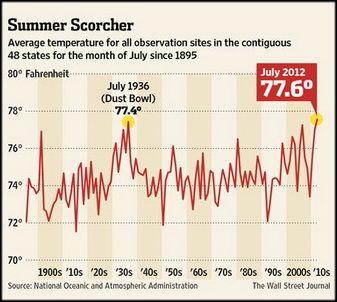
Even the Wall Street Journal chose the higher temperature reading to say that July of 2012 was July was the “hottest month in the contiguous U.S. since records began in 1895.” WUWT found this on accident and it has led to quite a few other revelations as we will see. Here is description in part of what we looking at:
Glaring inconsistencies found between State of the Climate (SOTC) reports sent to the press and public and the “official” climate database record for the United States. Using NCDC’s own data, July 2012 can no longer be claimed to be the “hottest month on record”.
[….]
I initially thought this was just some simple arithmetic error or reporting error, a one-off event, but then I began to find it in other months when I compared the output from the NCDC climate database plotter. Here is a table of the differences I found for the last two years between claims made in the SOTC report and the NCDC database output.
[….]
In almost every instance dating back to the inception of the CONUS Tavg value being reported in the SOTC report, there’s a difference. Some are quite significant. In most cases, the database value is cooler than the claim made in the SOTC report. Clearly, it is a systemic issue that spans over two years of reporting to the press and to the public.
It suggests that claims made by NCDC when they send out these SOTC reports aren’t credible because there are such differences between the data. Clearly, NCDC means for the plotter output they link to, to be an official representation to the public, so there cannot be a claim of me using some “not fit for purpose” method to get that data….
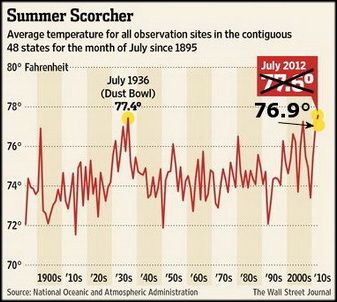
The Wall Street Journal made a graph showing this record setting month (below-left). The more accurate temperature for July likewise is shown in the same graph (below-right):
This looking at the data sets chosen and what is used and isn’t used to support an idea that fails in every way. Combine this obvious cherry-picking with the bias, collusion, and charges against the report that the President used to route Congress, all show we have a problem Houston! But this is only the tip of the proverbial iceberg. It seems the NOAA has been skewing these temps for some time. Why? Because the left uses this as a way to promote an ever growing government and the scientists get more-and-more funding. This data fudging story is newer, and it is evolving quickley, including this newest post via Real Science where Steve Goddard notes that More Than 40% Of USHCN Station Data Is Fabricated. Here is Dr. Judith carry’s synopsis (excerpted), in which she critiques a bit Goddard’s post… but then bows to the evidence:
OK, acknowledging that Goddard made some analysis errors, I am still left with some uneasiness about the actual data, and why it keeps changing. For example, Jennifer Marohasy has been writing about Corrupting Australian’s temperature record.
In the midst of preparing this blog post, I received an email from Anthony Watts, suggesting that I hold off on my post since there is some breaking news. Watts pointed me to a post by Paul Homewood entitled Massive Temperature Adjustments At Luling, Texas. Excerpt:
So, I thought it might be worth looking in more detail at a few stations, to see what is going on. In Steve’s post, mentioned above, he links to the USHCN Final dataset for monthly temperatures, making the point that approx 40% of these monthly readings are “estimated”, as there is no raw data.
From this dataset, I picked the one at the top of the list, (which appears to be totally random), Station number 415429, which is Luling, Texas.
Taking last year as an example, we can see that ten of the twelve months are tagged as “E”, i.e estimated. It is understandable that a station might be a month, or even two, late in reporting, but it is not conceivable that readings from last year are late. (The other two months, Jan/Feb are marked “a”, indicating missing days).
But, the mystery thickens. Each state produces a monthly and annual State Climatological Report, which among other things includes a list of monthly mean temperatures by station. If we look at the 2013 annual report for Texas, we can see these monthly temperatures for Luling.
Where an “M” appears after the temperature, this indicates some days are missing, i.e Jan, Feb, Oct and Nov. (Detailed daily data shows just one missing day’s minimum temperature for each of these months).
Yet, according to the USHCN dataset, all ten months from March to December are “Estimated”. Why, when there is full data available?
But it gets worse. The table below compares the actual station data with what USHCN describe as “the bias-adjusted temperature”. The results are shocking.
In other words, the adjustments have added an astonishing 1.35C to the annual temperature for 2013. Note also that I have included the same figures for 1934, which show that the adjustment has reduced temperatures that year by 0.91C. So, the net effect of the adjustments between 1934 and 2013 has been to add 2.26C of warming.
Note as well, that the largest adjustments are for the estimated months of March – December. This is something that Steve Goddard has been emphasising.
It is plain that these adjustments made are not justifiable in any way. It is also clear that the number of “Estimated” measurements made are not justified either, as the real data is there, present and correct.
Watts appears in the comments, stating that he has contacted John Nielsen-Gammon (Texas State Climatologist) about this issue. Nick Stokes also appears in the comments, and one commenter finds a similar problem for another Texas station.
Homewood’s post sheds light on Goddard’s original claim regarding the data drop out (not just stations that are no longer reporting, but reporting stations that are ‘estimated’). I infer from this that there seems to be a real problem with the USHCN data set, or at least with some of the stations. Maybe it is a tempest in a teacup, but it looks like something that requires NOAA’s attention. As far as I can tell, NOAA has not responded to Goddard’s allegations. Now, with Homewood’s explanation/clarification, NOAA really needs to respond….
So we see in the above, that temperatures can be changed years later as the totality of the data is included. What was considered the hottest falls to just an average month in the heat index.
And this has — within the past few months — turned into a very large debate.
EQUIPMENT FAIL II
Here is another example of older/faulty equipment:
A Quick Note about the Difference between RSS and UAH TLT data
There is a noticeable difference between the RSS and UAH lower troposphere temperature anomaly data. Dr. Roy Spencer discussed this in his July 2011 blog post On the Divergence Between the UAH and RSS Global Temperature Records. In summary, John Christy and Roy Spencer believe the divergence is caused by the use of data from different satellites. UAH has used the NASA Aqua AMSU satellite in recent years, while as Dr. Spencer writes:
…RSS is still using the old NOAA-15 satellite which has a decaying orbit, to which they are then applying a diurnal cycle drift correction based upon a climate model, which does not quite match reality.
While the two lower troposphere temperature datasets are different in recent years, UAH believes their data are correct, and, likewise, RSS believes their TLT data are correct. Does the UAH data have a warming bias in recent years or does the RSS data have cooling bias? Until the two suppliers can account for and agree on the differences, both are available for presentation.
The bottom line is that those wishing to expand regulation and laws and taxes on the rest of us fudge the facts. But facts-are-facts. And the ship is sinking for these lefties.