This is posted for adding to a conversation from FACEBOOK where I repeatedly noted no one ever paid 90% in taxes after it was brought up by my antagonist — hoping the operative word “PAID” would sink in — (conversation reproduced at the end of this post for clarity — JUMP.) Other Posts that discuss related issues:
- Wealth Inequality in America – Critiques On Inequality
- Rich Get Poorer | Poor Get Richer (+More Mantras Destroyed)
90% MYTH
(From the video):
- “economic historian Phil Magness, of the American Institute for Economic Research, says that progressives miss an important fact: The high tax rates that America had in the past actually didn’t bring in much revenue. When rates were at 70 percent, Magness tells John Stossel, ‘A millionaire on average would pay 41 percent’.”
Even “CheckYourFact” says this:
- While the top marginal income tax rate was over 90 percent [92%] while Eisenhower was president, few people were subject to that rate due to deductions and other tax loopholes. Top income earners paid much lower average tax rates.
(MISES.ORG has an excellent article dealing with the 90% issue, as well as GREY ENLIGHTENMENT)
ALMOST CLASSICAL notes this in their “The 90% Tax Rate Myth” post:
… So, let’s get more complicated. When there was a 94% top rate in 1944-45, there were so many deductions and exclusions that the taxable income was not comparable to someone’s entire income. First, the top rate started at $200,000, which today is equal to $2,413,059.90 — so the maximum EMTR would apply only to incomes of $2.5 million. But, that’s still taxable income, not earned income.
In 1944, you could deduct business meals, all business travel, all forms of interest payments, and much more. You could even deduct spousal travel expenses on a business trip! (Why travel alone?) Companies could also “loan” or “provide” almost anything to an employee, from an apartment to standard benefits. It was possible to shelter tens of thousands of dollars from taxable income. Three-martini lunches and expense accounts were important realities, skewing tax calculations.
As a result of deductions and exclusions, even the theoretical maximum Real Rate of taxation at 60% in 1944 overstates taxation dramatically. The reality? On earned income, the richest U.S. taxpayers paid close to 40 percent of their earned incomes in taxes in 1944. We simply didn’t count much of the compensation as taxable income.
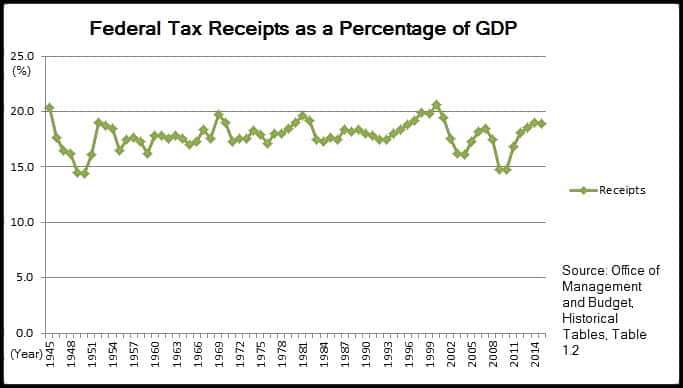
Allow me to introduce you to Hauser’s Law. Published in 1993 by William Kurt Hauser, a San Francisco investment economist, Hauser’s Law suggests, “No matter what the tax rates have been, in postwar America tax revenues have remained at about 19.5% of GDP.” This theory was published in The Wall Street Journal, March 25, 1993. For a variety of reasons, we seem to balance tax collections within a narrow range.
Since 1945, U.S. federal tax receipts have been fairly constant in terms of Gross Domestic Product (GDP), with taxes ranging from 15 to 20 percent of GDP. The graph is as follows:
When people demand higher taxes on the rich, usually phrased as paying a “fair share,” they are ignoring how our tax system has functioned historically. We could create more brackets, to tax the top 1% at a higher rate once again, but the net increase in tax revenues wouldn’t be dramatic. Why not? Because government spending is near historical highs: we are spending at near-WWII levels. It would be nearly impossible to tax enough to pay the federal bills, and doing so would likely crush the economy….
CREATING MORE REVENUE
So, what did JFK’s “the rising tide lifts all the boats,” Reagan’s tax cuts and Bush’s tax cuts show? (See: “John F. Kennedy and Ronald Reagan Proved Tax Cuts Work“) That lower taxes brings in more revenue.
- Should tax rates be higher? It’s the million dollar question! Up? Down? No change? Where in the world should taxes go? In election years, the question of tax rates fills the airwaves. In non-election years, the question of tax rates, again, fills the airwaves. So what’s the answer? UCLA Professor of Economics Tim Groseclose explains his research on the topic. Basically, there’s a certain point at which higher tax rates actually reduce the amount of revenue the government collects. What’s that point? When are tax rates too high? Learn a valuable lesson in economics, and public policy.
Which is why either a national sales tax or a flat tax would help fuel our GDP engine more. Thomas Sowell further explains via an excerpt (my scan from my book) of the “conclusion” of Thomas Sowell’s “The World of Numbers.” You can listen to the entirety of chapter 4 read via MIKE READS: Chpt 4(a) | Chpt 4(b).
I will also emphasize AEI’s PARTIAL QUOTE from my expanded quote — it has changed a bit due to my having the revised edition (as usual I add the references for people to further follow the rabbit trail):
THOMAS SOWELL
- Thomas Sowell, Discrimination and Disparities: Revised and Enlarged Edition (New York, NY: Basic Books, 2019), 110-114; (references), 255-257.
IMPLICATIONS
The emphasis on complex statistical analysis in economics and other fields— however valuable, or even vital, such statistical analysis may be in many cases— can lead to overlooking simple but fundamental questions as to whether the numbers on which these complex analyses are based are in fact measuring what they seem to be measuring, or claim to be measuring. “Income” statistics which lump together annual salaries and multi-year capital gains are just one of many sets of statistics which could stand much closer scrutiny at this fundamental level— especially if laws and policies affecting millions of human beings are to be based on statistical conclusions.
What can be disconcerting, if not painful, are the simple and obvious fallacies that can pass muster in intellectual circles when these fallacies seem to advance the prevailing vision of what is called “social justice.” Among prominent current examples is French economist Thomas Piketty’s large international statistical study of income inequality, which was instantly acclaimed in many countries, despite such obvious and fundamental misstatements as one pointed out by Professor Steven Pinker of Harvard:
Thomas Piketty, whose 2014 bestseller Capital in the Twenty-First Century became a talisman in the uproar over inequality, wrote, “The poorer half of the population are as poor today as they were in the past, with barely 5 percent of total wealth in 2010, just as in 1910.” But total wealth today is vastly greater than it was in 1910, so if the poorer half own the same proportion, they are far richer, not “as poor.”66
In addition to speaking of percentages as if they represented a given amount of income or wealth over the course of a century, Professor Piketty also made such assertions as that, in income, “the upper decile is truly a world unto itself,”67 when in fact just over half of all Americans are in that upper decile at some point in their lives.68 When Piketty said that the top one percent sit atop the “hierarchy” and “structure of inequality,”69 he again verbally transformed a changing mix of people in particular income brackets into a fixed structure rather than a fluid process, in which most Americans do not remain in the same quintile from one decade to the next.
Such misstatements are different expressions of the same fundamental misconception. As an empirical study of the 400 richest Americans pointed out, Piketty “naively assumes that it’s the same people getting richer.”70 But the majority of the 400 richest Americans have earned their fortunes in their own lifetimes, rather than being heirs of the 400 largest fortunes of the past!71
Such misconceptions are not peculiar to Professor Piketty. Nor are these the only problems with his statistics. But that such simple and obvious misstatements can pass muster in intellectual circles is a problem and a danger that goes far beyond Thomas Piketty.
Whether income differences are measured before taxes or after taxes can change the degree of inequality. If inequalities are measured both after taxes and after government transfers, whether in money or in goods and services, that can reduce the inequality considerably, when high-income people pay higher taxes and low-income people receive most of the government transfers.
Statistics on tax rates themselves can be grossly misleading when changes in tax rates are described in such terms as “a $300 billion increase in taxes” or “a $300 billion decrease in taxes.” In reality, all that the government can do is change the tax rate. How much tax revenue that will produce depends on how people react. There have been times when higher tax rates have produced lower tax revenues, and other times when lower tax rates have produced higher tax revenues,72 as well as times when tax rates and tax revenues moved in the same direction.
During the 1920s, for example, the tax rate on the highest income Americans was reduced from 73 percent to 24 percent— and the income tax revenue rose substantially73— especially income tax revenues received from people in the highest income brackets. Under the older and much higher tax rate, vast sums of money from wealthy investors were sheltered in tax-exempt securities, such as municipal bonds. The total amount of money invested in tax-free securities was estimated to be three times the size of the annual budget of the federal government, and more than half as large as the national debt.74
Such vast and legally untaxable sums of money caught the attention and aroused the ire of Secretary of the Treasury Andrew Mellon, who declared it “repugnant” in a democracy that there should be “a class in the community which cannot be reached for tax purposes.”75 Failing to get Congress to take steps toward ending tax exemptions for incomes from particular securities,76 Secretary Mellon sought instead to lower the tax rates to the point where it would in fact lead to collection of more tax revenues.
Tax-exempt securities tend not to pay as high a rate of return on investments as other securities, whose earnings are taxed. It made sense for wealthy investors to accept these lower rates of return from tax-exempt securities when the tax rate was 73 percent, but not after the tax rate was lowered to 24 percent. In terms of words on paper, the official tax rate on the highest incomes was cut from 73 percent to 24 percent in the 1920s. But, in terms of events in the real world, the tax rate actually paid— on staggering sums of money previously untouchable in tax shelters— rose from zero percent to 24 percent. This produced huge increases in tax revenues received from high-income people, both absolutely and as a percentage of all income taxes collected.77
This increase in income taxes collected from high-income taxpayers was a result of the plain fact that 24 percent of something is larger than 73 percent of nothing. Tax rate cuts in some later administrations also led to increases in tax revenues!78 For example, a front-page news story in the New York Times of July 9, 2006 said: “An unexpectedly steep rise in tax revenues from corporations and the wealthy is driving down the projected budget deficit this year.79
However unexpected this increase in tax revenues may have been to the New York Times and others decrying “tax cuts for the rich,” this was precisely the kind of outcome predicted and expected by others in various administrations over the years, who had urged that tax rates be cut, in order to get money disgorged from tax shelters and invested in the market economy. This included people in the Coolidge, Kennedy, Reagan and George W. Bush administrations, where there were similar outcomes.80 But the very possibility that tax rates and tax revenues can move in opposite directions is seldom mentioned in the media— a crucial error of omission.
These are not simply arguments about history. Among the consequences in our own time is that proposals to reduce income tax rates are automatically met with objections to reducing income tax revenues. In the Wall Street Journal of January 31, 2018, for example, economist Alan Blinder objected to tax rate cuts on grounds that “the deficit is already too large!”81
This is in defiance of what the New York Times reported about the unexpected reduction of the deficit by increased tax revenues during the administration of President George W. Bush. It is also in defiance of a record-breaking budget surplus after tax rates were reduced in the 1920s— a surplus large enough to allow about one-fourth of the national debt to be paid off.82 Like many others, Professor Blinder proceeded as if it were axiomatic that tax rate reductions mean tax revenue reductions.
There is, of course, no guarantee of what any given tax rate reduction will lead to in a given set of circumstances. But Professor Blinder’s assertion was not based on any argument that a tax rate reduction under particular current circumstances would lead to a reduction in tax revenues. There was in fact no argument whatever on that point, nor apparently any sense of need to make such an argument. Similarly, a twenty-first century book on President Calvin Coolidge likewise asserted that, as a result of the tax rate cuts during his administration, “the bounty that the rich enjoyed sapped the U.S. Treasury of funds it might have used for other ends.”83 Thus a record-breaking budget surplus under President Coolidge was verbally transmuted into a deprivation of funds, with the turn of a phrase.
All the voluminous and detailed statistics on tax rates and tax revenues published by the Internal Revenue Service, going back more than a hundred years, might as well not exist, as far as many of those with the prevailing social vision are concerned. This is ultimately not a question about history, but about what such heedlessness implies for the present and still more so for the future.
REFERENCES
66 Steven Pinker, Enlightenment Now: The Case for Reason, Science, Humanism, and Progress (New York: Viking, 2018), p. 99.
67 Thomas Piketty, Capital in the Twenty-First Century (Cambridge, Massachusetts: Harvard University Press, 2014), p. 252.
68 Thomas A. Hirschl and Mark R. Rank, “The Life Course Dynamics of Affluence,” PLoS ONE, January 28, 2015, p. 5.
69 Thomas Piketty, Capital in the Twenty-First Century, p. 278.
70 Robert Arnott, William Bernstein, and Lillian Wu, “The Myth of Dynastic Wealth: The Rich Get Poorer,” Cato Journal, Fall 2015, p. 461.
71 “Spare a Dime,” a special report on the rich, The Economist, April 4, 2009, p. 4.
72 See, for example, Phil Gramm and John F. Early, “The Myth of American Inequality,” Wall Street Journal, August 10, 2018, p. A15. See also Thomas Sowell, Basic Economics: A Common Sense Guide to the Economy, fifth edition (New York: Basic Books, 2015), pp. 426-427, 428.
73 Gene Smiley and Richard Keehn, “Federal Personal Income Tax Policy in the 1920s,” Journal ofEconomic History, Vol. 55, No. 2 (June 1995), p. 286; Benjamin G. Rader, “Federal Taxation in the 1920s,” The Historian, Vol. 33, No. 3 (May 1971), p. 432; Burton W. Fulsom, Jr., The Myth of the Robber Barons: A New Look at the Rise of Big Business in America, sixth edition (Herndon, Virginia: Young America’s Foundation, 2010), pp. 108, 115, 116.
74 Burton W. Fulsom, Jr., The Myth of the Robber Barons, sixth edition, p. 109.
75 Andrew W. Mellon, Taxation: The People’s Business (New York: The Macmillan Company, 1924), p. 170.
76 Gene Smiley and Richard Keehn, “Federal Personal Income Tax Policy in the 1920s,” Journal of Economic History, Vol. 55, No. 2 (June 1995), p. 289.
77 Burton W. Fulsom, Jr., The Myth of the Robber Barons, sixth edition, p. 116. The share of income tax revenues paid by people with incomes up to $50,000 a year fell, and the share of income tax revenues paid by people with incomes of $100,000 and up increased. At the extremes, taxpayers in the lowest income bracket paid 13 percent of all income tax revenues in 1921, but less than half of one percent of all income taxes in 1929, while taxpayers with incomes of a million dollars a year and up saw their share of income taxes paid rise from less than 5 percent to just over 19 percent. Gene Smiley and Richard Keehn, “Federal Personal Income Tax Policy in the 1920s,”Journal ofEconomic Histoy, Vol. 55, No. 2 (June 1995), p. 295; Benjamin G. Rader, “Federal Taxation in the 1920s,” The Historian, Vol. 33, No. 3 (May 1971), pp. 432-434.
78 Alan Reynolds, “Why 70% Tax Rates Won’t Work,” Wall Street Journal, June 16, 2011, p. A19; Stephen Moore, “Real Tax Cuts Have Curves,” Wall Street Journal, June 13, 2005, p. A13. Professor Joseph E. Stiglitz argued that the tax rate cuts during the Reagan administration failed: “In fact, Reagan had promised that the incentive effects of his tax cuts would be so powerful that tax revenues would increase. And yet, the only thing that increased was the deficit.” Joseph E. Stiglitz, The Price of Inequality (New York: W.W. Norton, 2012), p. 89. However, the tax revenues collected by the federal government during every year of the Reagan administration exceeded the tax revenues collected in any previous administration in the history of the country. Economic Report of the President: 2018 (Washington: Government Printing Office, 2018), p. 552; U. S. Bureau of the Census, Historical Statistics of the United States, Part 2, pp. 1104-1105. The deficit reflected the fact that there is no amount of money that Congress cannot outspend.
79 Edmund L. Andrews, “Surprising Jump in Tax Revenues Curbs U.S. Deficit,” New York Times, July 9, 2006, p. Al.
80 James Gwartney and Richard Stroup, “Tax Cuts: Who Shoulders the Burden?” Federal Reserve Bank of Atlanta Economic Review, March 1982, pp. 19-27; Benjamin G. Rader, “Federal Taxation in the 1920s: A Re-examination,” Historian, Vol. 33, No. 3, p. 432; Burton W. Folsom, Jr., The Myth of the Robber Barons, sixth edition, p. 116; Robert L. Bartley, The Seven Fat Years: And How to Do It Again (New York: The Free Press, 1992), pp. 71-74; Alan Reynolds, ‘Why 70% Tax Rates Won’t Work,” Wall Street Journal, June 16, 2011, p. A19; Stephen Moore, “Real Tax Cuts Have Curves,” Wall Street Journal, June 13, 2005, p. A13; Economic Report of the President: 2017 (Washington: Government Printing Office, 2017), p. 586. See also United States Internal Revenue Service, Statistics of Income 1920-1929 (Washington: Government Printing Office, 1922-1932).
81 Alan S. Blinder, “Why Now Is the Wrong Time to Increase the Deficit,” Wall Street Journal, January 31, 2018, p. A15.
82 The national debt, which was a little over $24 billion in 1920— the last year of President Woodrow Wilson’s administration— was reduced to less than $18 billion in 1928, the last year of President Calvin Coolidge’s administration. U. S. Bureau of the Census, _Historical Statistics ofthe United States, Part 2, p.1104. See also David Greenberg, Calvin Coolidge (New York: Times Books, 2006), p. 67.
CONVERSATION