“The DeBunkers” Debunk Cost of Education/Student Loan Forgiveness

The Debunkers DESTROY Student Loan Forgiveness! (They debunk this video)

People always demand that the government should make some particular product or service more ‘affordable’. Thomas Sowell explores how the government can do that and if is it really even desirable to have the government manipulate the economy to make some things more affordable at the expense of others. This is an excerpt from the book ‘The Thomas Sowell Reader’

Why Is Education So Expensive In The United States?

(Stossel FLASHBACK) Politicians promise to help everyone go to college. But they just make college more EXPENSIVE. Did you know that the University of Missouri is proud to have a “leisure resort” on campus? Naomi Riley, author of The Faculty Lounges: And Other Reasons Why You Won’t Get the College Education You Pay For, explains how government aid led to massive tuition hikes.

Colleges get massive subsidies and tax breaks. They get rich. Taxpayers and many students are hurt.

Why is college tuition so high? Why are so many students in so much debt? Is it the fault of colleges, the government, or both? And can anything be done? Get the answers in this short video.

California Education Failure: Progressive Minority Leadership in California

Many Californians wondered if a black or Hispanic politician would replace Kamala Harris in the U.S. Senate. After California Secretary of State Alex Padilla was chosen, Larry Elder looked into the effect of progressive minority leadership in California on things like education in the state. Does it actually make a difference? Unfortunately, California schools are failing students, even though research shows districts spend more money on poor and minority students than other children. Meanwhile, progressive politicians are still adamantly opposed to school choice.

  • QUESTION: does the above get better or worse with the school shutdown? (One Answer) If more people start homeschooling… better. — me

Democrats on Race, Slavery, and Education (Larry Elder)

Larry Elder reads from a Wall Street Journal article entitled, “An Education Horror Show A Case Study In Public School Failure And Lack Of Accountability“. A key point in this article which leads into Walter Williams article is this: “One culprit are policies that discourage student discipline.” Doc Williams’ article (Black Education Decline) notes this:

  • A National Center for Education Statistics study found that 18% of the nation’s schools accounted for 75% of the reported incidents of violence, and 6.6% accounted for half of all reported incidents. These are schools with predominantly black student populations.

Everything the Democrats are offering will embolden this problem, not help dissuade it.

I also add at the end a different Denzel Washington clip, Larry merely played the first one again. Here is another example of just how far discipline in schools have eroded (Meridian Star, 4/21/16 — via RPT).

  • I read that in a survey of public school teachers in 1940, the top disciplinary problems listed included talking out of turn, chewing gum, running in the halls, dress-code violations, and littering. More than a half century later, the problems teachers contend with are drug and alcohol abuse, pregnancy, suicide, rape, robbery, and assault. Teachers and administrators say that things are worse for students now than ever before. One junior high school teacher commented, “I can’t believe the things they do to themselves and to each other.” A kindergarten teacher recently told me that her five and six year old students are restless, angry, and some even have the addictive habit of cutting themselves. A grandmother told me that her grandson, whom she is raising, has admitted to having suicidal thoughts. He is ten years old. 

What a comparison. What teacher today wouldn’t fall on her knees and shout Hosannas to have the problems teachers did in 1940?

  • “Andy, is that gum in your mouth?”
  • “Yes, teacher.”
  • “Go to the principal’s office!”

Can anyone even imagine?

Military Spending vs. Education and Health-Care Spending

(I am changing some of my “Pages” to “Posts,” so some of this info is older to my site)

Total GDP Expenditures on

★ MILITARY (2014): 3.5%

★ EDUCATION (2014): 4.9%

★ HEALTH (2014): 17.1%

NATIONAL REVIEW has a great article on this:

A few more thoughts on the view from 1957. Relative to the size of the U.S. economy (which is to say, as a share of GDP) we have cut military spending to barely a third of what it was in 1957, from 9.8 percent of GDP then to 3.3 percent of GDP now. Even though we were spending three times as much on national defense in 1957—and even though we had lower taxes (17.2 percent of GDP then vs. 17.7 percent of GDP today) we ran a budget surplus. It’s usually described as a “modest” surplus, but at 3.4 percent of GDP, the budget surplus of 1957 was proportionally larger than military spending is in 2015.

So, where’d the money go?

Feel free to consult the historical data yourself, but the short answer is: welfare spending.

The broadest budget categories are national defense, human resources, physical resources, net interest, other functions, and undistributed offsetting receipts. National defense, net interest, other functions, and undistributed receipts are pretty self-explanatory; human resources includes welfare and health-care programs, entitlements such as Medicare and Social Security, and education spending. Physical resources means things like energy development, transportation, natural resources maintenance, environmental conservation, and community- and regional-development programs, the “infrastructure” we’re always going on about.

[….]

Recap: In GDP terms, we spend about a third on the military today compared to what we spent in the late 1950s. We spend almost exactly the same on interest on the debt. We spend 20 percent less on energy, transportation, the environment, and natural resources. And we spend almost four times as much on welfare. Again, that is in GDP terms, and our economy is a heck of a lot bigger than it was in 1957. As a share of all federal spending, welfare has gone from 23 percent of spending to 73 percent of federal spending. In constant-dollar terms, we spend 17.5 times as much. In nominal-dollar terms, we spend 150 times as much.

(Read It All)


Michael Medved dismantles a callers charge that we (as a country) spend more on the military than education and other social programs (2009).

One General says that 4% on military (GDP) if the floor… very bottom… we should not go below this percentage: Admiral Mike Mullen, former Chairman of the Joint Chiefs of Staff, has called four percent an “absolute floor” (New York Times). Here Forbes explains a bit:

Bullets vs. Band-aids: Is Health Spending Crowding out Defense?

….But as an empirical matter, the share of GDP absorbed by federal taxes has been astonishingly stable since 1946—averaging less than 18 percent and exceeding 20 percent in only one year (2000).[3] The president’s own budget shows federal receipts going no higher than 19.2 percent of GDP by 2017. But he has put us on a path that his own Department of Treasury has declared is “unsustainable.” Why? Because health entitlements under Obamacare will grow so rapidly that federal spending as a share of GDP will grow by more than 40 percent by the year 2085. Rising health entitlements will account for every penny of that increase!

With projected federal spending topping 34 percent of GDP and the known politically acceptable levels of federal tax revenues falling below 20 percent of GDP, we are between the proverbial rock and a hard place. Being able to afford even 4 percent of GDP for national defense—we’ve averaged 6.4 percent since 1946—will grow increasingly problematic. This is not just some future hypothetical: as it is, we currently are spending $50 billion less on defense in FY2013 than outgoing Secretary of Defense said just two years ago would be needed this year. And remember that Obamacare spending kicks in with a vengeance in 2014.  Thus, the choice between bullets and butter will be harder to make each year we keep kicking the can down the road instead of addressing health entitlements….

While the following video is about Bernie Sanders… the portion starting at about the 4:54 mark:

In another excellent “myth busting” article at The Heritage Foundation, we read some examples of the importance in the GDP metric for healthy ~MILITARY~ spending:

Defending Defense:
Setting the Record Straight on US Military Spending Requirements

(To see references, download PDF)

Myth

Additional defense spending is unnecessary as the United States already spends more on defense than half the world combined.

Fact

No other country in the world has the enduring vital national interests of the United States, and therefore the U.S. military has global reach and responsibilities. Comparing the unique needs of U.S. security and the resources required against those of other countries is misleading. Further, it is not surprising that the richest nation on earth and history’s “sole superpower” should have a first-rate military; the overall dollar cost is mostly a measure of the size of our economy. What is surprising is that we get so much from such a small proportion of our wealth. As Mackenzie Eaglen of the Heritage Foundation writes,

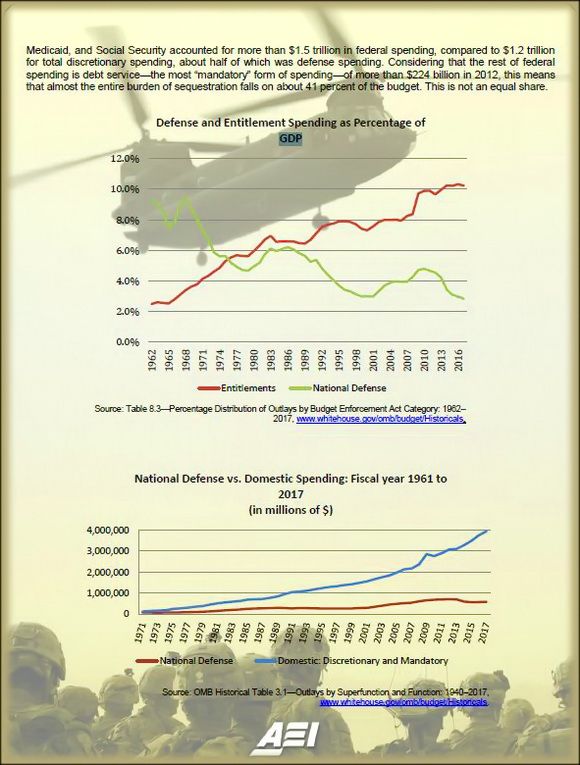
Defense spending is near historic lows… Between 2010 and 2015, total defense spending is set to fall from 4.9 percent to 3.6 percent of gross domestic product (GDP), even though the nation has assigned more missions to the military over the past two decades.[1]

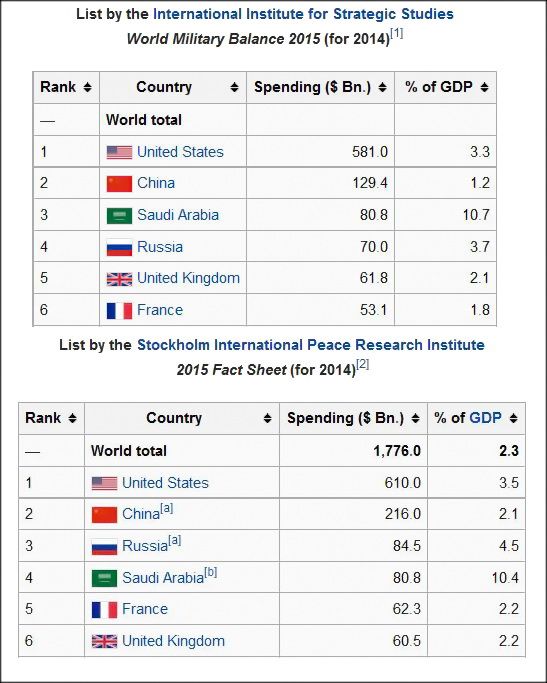
A narrow focus on strictly dollar figures is also misleading. Consider China’s military budget, which Beijing claims is $78 billion for this year. The Pentagon estimates that the relative “purchasing power” of the Chinese military is actually closer to $150 billion, in good part because China does not have to pay their soldiers, sailors, and airmen anything comparable to what the United States pays its servicemen and women.[2]  By this yardstick, China moves from fifth place in overall military spending among the nations of the world to second.[3] And more to the point, China’s defense expenditures are focused primarily on gaining military leverage in a distinct region of the world—Asia—while the U.S. military has responsibilities everywhere. The resources the U.S. military can actually deploy “in theater” are not vastly superior to those of the Chinese. Simple comparisons of defense expenditures are deceptive measures of the unique needs of America’s armed forces.

Myth

Pentagon budgets were a “gusher” of new money in the Bush Administration.

Fact

In his recent drive to cut overhead, Defense Secretary Robert Gates indeed described the emergency supplemental appropriations for the costs of Iraq and Afghanistan as a “gusher.”[4] But as AEI’s Gary Schmitt and Tom Donnelly have written,

The budget increases that have occurred…are largely tied to fighting the wars. When Bill Clinton left the White House and Dick Cheney told the military that “help [was] on the way,” the defense burden stood at 3 percent of GDP—a post-World War II low. When George W. Bush headed out the door, the figure for the core defense budget was about 3.5 percent. This is an increase, to be sure, but not one to make the military flush after a decade of declining budgets and deferred procurement.[5]

One of the consistent and correct purposes of the wartime supplementals was to “reset” the force—to return the military to at least pre-war readiness levels. This goal is still a long way off. The backlogs at service repair depots will take years to work through.

More profoundly, very little wartime funding went to increase the number of U.S. ground forces. The strains on soldiers and Marines—reflected in rising suicide rates, for example—have yet to be fully calculated. And despite the withdrawal of combat forces from Iraq and President Obama’s deadline for drawdown in Afghanistan, the Army and Marine Corps will continue to deploy overseas for years, an effort that can only be sustained by a reduced pace of operations, sharing the constant burden across a larger force.

There is a moral obligation not only to bind the wounds and tend to the families of those who have fought so well and so long, but also to give them what they need to continue to answer the call to service. Further, the government’s Constitutional obligation is to “provide for the common defense,” and to “secure the blessings of liberty” now and for future generations. This is the government’s fundamental obligation to its citizens and its cardinal contribution to our liberties.

[….]

Myth

Current levels of defense spending are unaffordable.

Fact

The defense budget is a relatively small slice of the $14-plus-trillion American pie. And it’s a shrinking slice: as a percentage of our economy and as a percentage of the federal budget, the burden of defense is declining. President Obama’s long-term budget projections also reduce Pentagon spending in real dollars.

Moreover, the idea that defense cuts will restore fiscal health simply does not add up: suppose Pentagon spending for 2011—$720 billion—were eliminated entirely.[7] This would only halve this year’s federal deficit of $1.5 trillion. And defense spending is a drop in the ocean of today’s $13.3 trillion of government debt. From the Korean War to the collapse of the Soviet Union, total U.S. defense spending was about $4.7 trillion.[8] So had there been no military spending at all during the Cold War, the savings would not equal even half our current national debt.

Talking about defense spending in isolation while discussing the overall federal budget is also misleading. Defense is not the source of the federal government’s fiscal woes. As Mackenzie Eaglen notes,

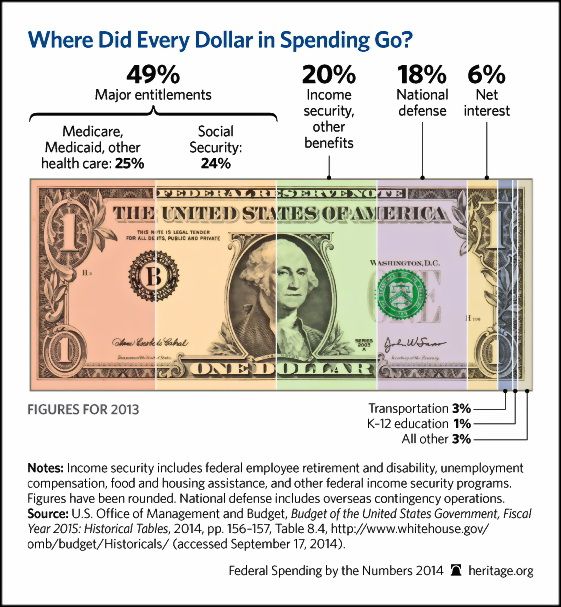
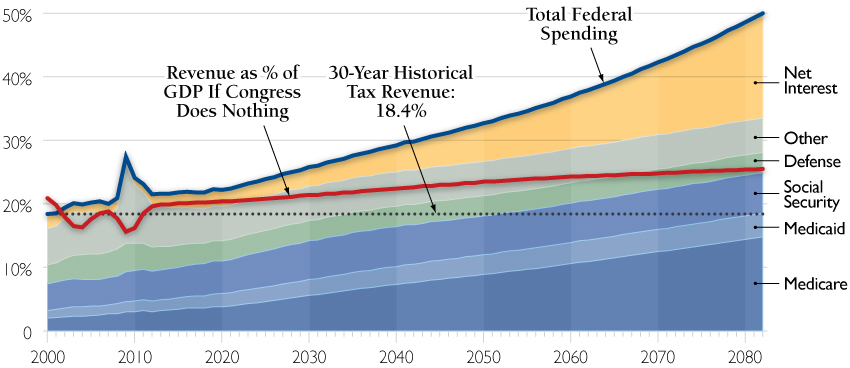
The substantial decline in the defense share of the budget largely reflects the dramatic growth of entitlement spending. Entitlements now account for around 65 percent of all federal spending and a record 18 percent of GDP. The three largest entitlements— Social Security, Medicare, and Medicaid—eclipsed defense spending in 1976 and have been growing ever since. If future taxes are held at the historical average, these three entitlements will consume all tax revenues by 2052, leaving no money for the government’s primary constitutional obligation: providing for the common defense.[9]

Over the past decade, necessary defense spending increases are responsible for less than 20 percent of all new spending from 2001 to 2009. This does not even include 2009 stimulus spending totaling $787 billion, with almost no money for defense.

Myth

The United States should not be “the world’s policeman.”

Fact

At a cost of less than one nickel of the American taxpayers’ dollar—and only 4.9 percent of U.S. GDP—the United States has fought two wars and provided the essential backbone for a system of global security; by any measurement, it’s an amazing bargain.[10]

The investments made during the Cold War—including the Reagan build-up— continue to pay global dividends. Europe, for the first time in centuries, enjoys a durable peace. East Asia, for millennia a theater of violent competition, is emerging as an economic dynamo, lifting hundreds of millions out of poverty.

Yet this peace and the prosperity it helps to create are not self-generating or selfsustaining. No other nation, or group of nations, is ready, willing or able to take on America’s role. As the Quadrennial Defense Review Independent Panel observed, the future is

…likely to place an increased demand on American “hard power” to preserve regional balances. While diplomacy and development have important roles to play, the world’s first-order problems will continue to be our security concerns….As the last 20 years have shown, America does not have the option of abandoning a leadership role in support of its national interests….Failure to anticipate and manage the conflicts that threaten those interests…will not make those conflicts go away….It will simply lead to an increasingly unstable and unfriendly global climate and, eventually, to conflicts America cannot ignore.[11]

In short, the cost of preserving America’s role in the world is far less than would be the cost of having to fight to recover it or, still greater, the cost of losing it altogether. While many Americans would prefer to see our allies and partners play a larger part in securing the blessings of our common liberty, no president of either political party has backed away from America’s global leadership role —a bipartisan consensus that remains strong evidence that American leadership is still necessary to protect the nation’s vital interests.

The American Enterprise Institute (AEI) makes the continuing point of just-how-much burden is put on the U.S. military around the world (Defense Spending 101 PDF):

We are spending more on our military than half of the rest of the world combined is spending on defense. Do we really need to spend that much?

Questions about what America spends on defense versus what other nations spend on defense should be understood in the context of what we ask our military to do, what our role in the world is, and who our enemies and adversaries are and are likely to be.

From the Cold War to the post-9/11 world, US spending on national defense has given our country a military preeminence that, in turn, has yielded enormous strategic returns by:

  • Protecting the security and prosperity of the United States and its allies;
  • Amplifying America’s diplomatic and economic leadership throughout the globe;
  • Preventing the outbreak of great-power wars that marked previous centuries;
  • Preserving the international order in the face of aggressive, illiberal threats.

As the congressionally mandated, bipartisan Independent Review Panel of the Quadrennial Defense Review spelled out, this has required a military that has four “enduring” tasks:

  • Defense of the homeland
  • Assuring access to the sea, air, space and, now, cyberspace
  • Preserving a favorable balance of power across Eurasia that prevents authoritarian domination of that region
  • Providing for the global common good through such actions as humanitarian aid, development assistance, and disaster relief

These are obviously large tasks, requiring significant military resources. They are also complicated, as the panel also notes, by five global trends:

  • Radical Islamist extremism and the threat of terrorism
  • The rise of new global great powers in Asia
  • Continued struggle for power in the Persian Gulf and the greater Middle East
  • An accelerating global competition for resources
  • Persistent problems from failed and failing states

The strength of this global international order provides America and its allies with real security at a low price while imposing tremendous costs on would-be adversaries. Consider the case of China’s rise. Over the past generation, China’s meteoric economic development has also allowed for a steady, now two-decades-long program of military modernization. Estimates are that Beijing now spends about $170 billion per year on its formal defense program, but that figure would be considerably higher if the Chinese military had to pay its soldiers, airmen, and sailors’ salaries comparable to what their counterparts in the US military earn.

Moreover, China’s expenditures are focused primarily on gaining military leverage in a distinct region of the world—Asia—while, as noted above, the US military has global responsibilities. The tasks in this equation are disproportionate: America seeks to keep the peace in East Asia because it is a vital element in the international system and important to America’s interests. while East Asia seeks to disrupt the regional balance and have no comparable stakes elsewhere.

The fact that we can afford to maintain a military capable of keeping the great powers of the world at peace is a bargain at four cents on the dollar. And the fact that our allies. including former adversaries, have renounced the use of force except in support of American-led coalitions should be thought of as a triumph. The further fact that a potential challenger like China has such a steep hill to climb is an advantage to maintain: it would be preferable to deter China than to fight her.

Obama Spent BILLIONS On Failing Schools – No Change

Here is a portion of the WASHINGTON POST that Prager was reading:

One of the Obama administration’s signature efforts in education, which pumped billions of federal dollars into overhauling the nation’s worst schools, failed to produce meaningful results, according to a federal analysis.

Test scores, graduation rates and college enrollment were no different in schools that received money through the School Improvement Grants program — the largest federal investment ever targeted to failing schools — than in schools that did not.

The Education Department published the findings on the website of its research division on Wednesday, hours before President Obama’s political appointees walked out the door.

“We’re talking about millions of kids who are assigned to these failing schools, and we just spent several billion dollars promising them things were going to get better,” said Andy Smarick, a resident fellow at the American Enterprise Institute who has long been skeptical that the Obama administration’s strategy would work. “Think of what all that money could have been spent on instead.”…

We Spend More on Education than the Military (UPDATED STATS)

UPDATED STATS!!

Total GDP Expenditures on education from 2011 (source): 6.9%

Total GDP Expenditures on the military from 2014 (source): 3.5%

Total GDP Expenditures on health from 2011 (source): 17.7%

(The below was originally Posted April 4th, 2011)

I posted a link to the following audio of Michael Medved [as a response to a challenge from a youngster in conversation elsewhere on the WEB] taking a challenge from a caller on how much we spend on education versus the military.

He challenged the stats used by Michael Medved. I enjoy challenges like these if only it makes me work a bit harder to understand the minutia of the figures involved:

I wanted to post some of the stats here for my future use and set up the discussion as it went on FaceBook:

Young Man

  • Or……. We could just do away with the whole military industrial complex. Sounds allot better to me.

Me

  • How bout the “Educational Industrial Complex?” Your terms are meaningless. We spend more on education than we do on military.

Young Man

  • I’m not sure where you get your facts Sean, but last time I checked The Federal Government spends more on defense than anything else, Espically now sice we are running 3 wars and aid efforts to Japan.

Me

  • Here is a great example of a real world challenge. I have posted this to you in a previous discussion… but i doubt you actually take the time to stop and think critically on these issues, which demand time and reflection. This is only 5-minutes: http://www.youtube.com/watch?v=KV8ITndPp0A

Young Man

  • Yeah i’m sure Medvid gets his stats from Fox as well. Idk, why you gave me a vid of some guy droning on about Bush its really besides the point. Medvid does nothing to further your point either.

I wish to intercede here and mention the derangement syndrome often mentioned  inregards to a few people/organizations. Of course we had versions of this with most Presidential candidates, like Reagan. But I think it really hit a crescendo with President George W. Bush

Some terms for knowledge:

  • BDS – Bush Derangement Syndrome;
  • PDS – Palin Derangement Syndrome;
  • FDS – Fox Derangement Syndrome.

….Of course Sarah Palin felt this recent wave of hatred, but there is also this liberal transfer of emotion onto whole erganizations. Here I speak of Fox News. In order for this young man to reject facts… all he needed to do was connect the stated facts from Medved to Fox News, and wallah! the facts as well as myself are wrong. So I found the following to back the stats mentioned by Medved. The first comes from Wikipedia — I highly recommend the researcher at heart following the many links involved in this article — and it deals with the total expenditure as % of GDP by country spent on their military:

Rank Country 2009 Spending ($ b.) Share of 2008 GDP (%) World Share (%)
1 United States United States 661 4.3 43
2 People's Republic of China Chinaa 100 2.0 6.6
3 France France 63.9 2.3 4.2
4 United Kingdom United Kingdom 58.3 2.5 3.8
5 Russia Russiaa 53.3 3.5 3.5
6 Japan Japan 51.0 0.9 3.3
7 Germany Germany 45.6 1.3 3.0
8 Saudi Arabia Saudi Arabiab 41.3 8.2 2.7
9 India India 36.3 2.6 2.4
10 Italy Italy 35.8 1.7 2.3
11 Brazil Brazil 26.1 1.5 1.7
12 South Korea South Korea 24.1 2.8 1.6
13 Canada Canada 19.2 1.3 1.3
14 Australia Australia 19.0 1.8 1.2
15 Spain Spain 18.3 1.2 1.2

This next section deals with the total expenditure as % of GDP by country spent on education:

# 1 United States: 7 % of GDP
# 2 Denmark: 6.7 % of GDP
# 3 Sweden: 6.5 % of GDP
# 4 Canada: 6.4 % of GDP
# 5 France: 6.1 % of GDP
# 6 Australia: 6 % of GDP
# 7 Norway: 5.9 % of GDP
# 8 New Zealand: 5.8 % of GDP
= 9 Switzerland: 5.7 % of GDP
= 9 Austria: 5.7 % of GDP
# 11 Finland: 5.6 % of GDP
# 12 Belgium: 5.5 % of GDP
= 13 Germany: 5.3 % of GDP
= 13 United Kingdom: 5.3 % of GDP
# 15 Italy: 4.9 % of GDP

And this final section deals with total expenditure as % of GDP by country spent on health services:

# 1 United States: 13.9 % of GDP
# 2 Switzerland: 10.9 % of GDP
# 3 Germany: 10.8 % of GDP
= 4 Canada: 9.4 % of GDP
= 4 France: 9.4 % of GDP
= 4 Greece: 9.4 % of GDP
# 7 Portugal: 9.3 % of GDP
# 8 Iceland: 9.2 % of GDP
# 9 Australia: 9.1 % of GDP
# 10 Belgium: 9 % of GDP
# 11 Sweden: 8.8 % of GDP
# 12 Denmark: 8.6 % of GDP
# 13 Netherlands: 8.5 % of GDP
# 14 Italy: 8.3 % of GDP
# 15 Norway: 8.1 % of GDP

So let us do some addition and subtraction. Without the wars in Afghanistan and Iraq, military spending would be around 3.2% of the total total expenditure of GDP. Let us now add health and educational services: it would equal 20.9% of the total total expenditure of GDP.  Obviously the “Industrial Complex” lays more in education and health worker/government unions than in the military! One article makes the following comparison and then asks where he can sign up to this free stuff:

….Medicare spending in 2010 was five times the amount it was just thirty years ago. Medicaid spending is up six fold – as a percentage of GDP. In 1971 the federal government spent 1% of GDP providing health care to the elderly and the poor; now they are spending 5.5%. That is not a sustainable growth trend.

Year Medicare Medicare Medicaid Medicaid

% GDP Spending % GDP Spending

1971 0.7% $7.5 billion 0.3% $3.4 billion

2010 3.6% $520 billion 1.9% $273 billion

Once you add in Social Security and income security (welfare) spending, entitlements now account for 13.2% of GDP compared to just 6.7% in 1971. How, when the country is wealthier today than it was in 1971, can more people be entitled to more free stuff than ever before? The sense of entitlement is astounding. Plenty of people in the US believe they are entitled to other people’s money by merely gracing the country with their presence. The bottom 40% of income earners already faces no federal income tax liability, yet they feel entitled to free stuff. Seniors feel entitled to generous Medicare payments, but they didn’t contribute enough money during their working years to even come close to paying for their own medical bills in retirement. Again, they feel entitled to other people’s money.

All play and no work will make the US a poor country. At what point are the actual US taxpayers entitled to expect others to work and help pay the bills? Is there a section of society that is permanently entitled to sponge off of everyone else with no strings attached? If so, where can I sign up?

…(read more)…

What needs to change is the U.S. getting out of security issues Europe should worry about more than we should!

We need to clean our own fiscal house and not worry about others.

Lack of Wealth Redistribution Is Baltimore’s Issue ~ Maryland Democrat

Via HotAir

Updated Numbers via National Review:

…Although Baltimore ranks fourth among major cities in per-pupil expenditures for districts with more than 40,000 students and spends $16,578 a year per pupil — roughly 52 percent above the national average — more than a quarter of Baltimore students fail to graduate from high school. Fewer than half of Baltimore high-school students passed the last Maryland High School Assessment test. SAT scores for Baltimore students are more than 100 points below the national average.

Yet Maryland has one of the nation’s most restrictive charter-school laws. There are just 52 charter schools statewide. In neighboring Washington, D.C., 44 percent of the city’s public-school students are educated in the District’s 112 charter schools, according to the National Alliance for Public Charter Schools. Even within the public schools, choice is extremely limited in Maryland; parents are not generally allowed to send their children to schools outside their assigned district. Needless to say, any larger efforts to give parents more control over their children’s schooling — such as vouchers or tax credits — have gone nowhere….

Schools:

The Baltimore school system ranked second among the nation’s 100 largest school districts in how much it spent per pupil in fiscal year 2011, according to data released Tuesday by the U.S. Census Bureau.

The city’s $15,483 per-pupil expenditure was second to New York City’s $19,770. Rounding out the top five were Montgomery County, which spent $15,421; Milwaukee public schools at $14,244; and Prince George’s County public schools, which spent $13,775.

The Census Bureau also noted the first decrease in per-pupil spending nationally since 1977, the year the figures were first tracked….

…read more…

The public schools in Washington, D.C., spent $29,349 per pupil in the 2010-2011 school year, according to the latest data from National Center for Education Statistics, but in 2013 fully 83 percent of the eighth graders in these schools were not “proficient” in reading and 81 percent were not “proficient” in math.

These are the government schools in our nation’s capital city — where for decades politicians of both parties have obstreperously pushed for more federal involvement in education and more federal spending on education.

[….]

In 2013, students nationwide took NAEP reading and math tests. When the NCES listed the scores of public-school eighth graders in the 50 states and the District of Columbia, D.C. came in last in both subjects.

D.C. eighth graders scored an average of 248 out of 500 in reading, and Mississippi finished next to last with an average of 253.

Only 17 percent of D.C. 8th graders rated “proficient” or better in reading. In Mississippi, it was 20 percent.

In math, D.C. public-school eighth graders scored an average of 265 out of 500, and only 19 percent were rated “proficient” or better. Alabama placed next to last with an average math score of 269, with 20 percent rated “proficient” or better.

Some might argue it is unfair to compare, Washington, D.C., a single city, with an entire state. However, D.C. also does not compete well against other big cities.

The Department of Education’s Trial Urban District Assessments program compares the test results in 21 large-city school districts, including Washington, D.C.

In these assessments, the scores of students from charter schools were removed and the average reading score for D.C. public school eighth-graders dropped to 245. That was below the national large-city average of 258, and tied D.C. with Fresno for seventeenth place among the 21 big cities in the TUDA.

In math, minus the charter school students, D.C. public-school eighth graders earned an average score of 260. That was below the national large-city average of 276, and put D.C. in a tie for sixteenth place, this time with Fresno and Baltimore.

The NCES database indicates that in the 2010-2011 school year, Washington, D.C. public schools spent a total of $29,349 per pupil, ranking No. 1 in spending per pupil among the 21 large cities in the TUDA.

…read more…

Do Graduate Degrees Help ~ Peter Schiff

From Libertarian Republican:

Stick with it. It’s a good 5 minutes long. But it will have you splitting your sides with laughter. My personal favorite, the guy about 1 1/2 minutes in working at a Pizzeria with a 4-year degree. Schiff is a hardline libertarian economist who frequently appears on Fox Business and CNBC.

“That’s pretty much every bartender in this city,” and she would probably know.

Did Matt Damon “School” This Reporter?

Two quick responses ~ Firstly, teachers ARE well paid:

$34.06 an Hour ~ That’s how much the average public school teachers makes. Is that “underpaid”?

Who, on average, is better paid–public school teachers or architects? How about teachers or economists? You might be surprised to learn that public school teachers are better paid than these and many other professionals. According to the Bureau of Labor Statistics, public school teachers earned $34.06 per hour in 2005, 36% more than the hourly wage of the average white-collar worker and 11% more than the average professional specialty or technical worker.

In the popular imagination, however, public school teachers are underpaid. “Salaries are too low. We all know that,” noted First Lady Laura Bush, expressing the consensus view. “We need to figure out a way to pay teachers more.” Indeed, our efforts to hire more teachers and raise their salaries account for the bulk of public school spending increases over the last four decades. During that time per-pupil spending, adjusted for inflation, has more than doubled; overall we now annually spend more than $500 billion on public education.

The perception that we underpay teachers is likely to play a significant role in the debate to reauthorize No Child Left Behind. The new Democratic majority intends to push for greater education funding, much of which would likely to go toward increasing teacher compensation. It would be beneficial if the debate focused on the actual salaries teachers are already paid.

It would also be beneficial if the debate touched on the correlation between teacher pay and actual results. To wit, higher teacher pay seems to have no effect on raising student achievement. Metropolitan areas with higher teacher pay do not graduate a higher percentage of their students than areas with lower teacher pay.

In fact, the urban areas with the highest teacher pay are famous for their abysmal outcomes. Metro Detroit leads the nation, paying its public school teachers, on average, $47.28 per hour. That’s 61% more than the average white-collar worker in the Detroit area and 36% more than the average professional worker. In metro New York, public school teachers make $45.79 per hour, 20% more than the average professional worker in that area. And in Los Angeles teachers earn $44.03 per hour, 23% higher than other professionals in the area.

…(read more)…

Mr. Damon is simply passing on talking points probably heard from “memes.” A second point is that tenure is a huge part of the problem. A teacher reaches tenure after just two years of doing what, working. This should be based on how well they perform and have a go at tenure after say, 5 years with a two-year interim to try again.This will weed out bad teachers or teachers that may be predators of younger persons. You see, is a teacher is tenured after only two-years, when it comes to light that they may have some indecent relationships with students it is almost impossibly to fire them and they get moved from district to district before they are finally canned. Having a longer period of tenurship often times allows some committee that would tenure teachers more insight into the teachers character.

Here is the video from the people that asked the question of Matt:

And from REASONTVS BLOG on the topic:

At last Saturday’s “Save Our Schools” rally, a fairly livid actor Matt Damon told Reason.tv that teachers make a “shitty” salary. Is the Oscar winner right about that?

The short answer is no. The longer answer? Also no.

According to Department of Education statistics for 2007-2008 (the most recent year listed), the average public school teacher brought in a bit over $53,000 in “total school-year and summer earned income.” That figure, which is about $13,000 more than what the average private-school teacher gets in straight salary, does not include health and retirement benefits, places where teachers almost always get better deals and bigger employer contributions than the typical private-sector worker. For more on teacher compensation, go here.

An average salary of $53,000 may not be much for a movie star such as Damon, but it’s a pretty good wage when compared to U.S. averages. Indeed, the Census Bureau reports that median household income in 2008 was $52,000. Teaching in most public schools requires a bachelor’s degree and here teachers fare less well on first glance, though still not awful. The median income for a man with a B.A. was $82,000; for a woman, it was $54,000. About three-quarters of teachers are women, so the average salaries when gender comes into play hew closely to one another.

More to the point, Bureau of Labor Statistics and other surveys that take into account the reported number of hours worked in a year consistently show that on a per-hour basis, teacher income (again, not including fringe benefits, which are typically far more robust than those offered other workers, including college-educated professionals) is extremely strong.

 …(read more)...

MORE from this great post from EDUCATION NEXT:

Each year, the two national teacher unions, the American Federation of Teachers (AFT) and the National Education Association (NEA), release their surveys of public school teacher salaries across the nation. And each year, they take advantage of this opportunity to bemoan the condition of teacher pay. On the April 2002 release of the NEA’s data, then-NEA president Bob Chase complained, “It’s hard to convince someone to stay in the classroom when the salary is so low.” Likewise, the AFT decried the fact that the “average teacher salary continues to fall well below the average wages of other white-collar occupations.” The average teacher, according to the AFT, earned $43,250 during the 2000-01 school year, compared with an average of $52,664 for mid-level accountants; $71,155 for computer system analysts; $74,920 for engineers; and $82,712 for attorneys.

Of course, the AFT has chosen the comparison groups to make its best case. Where, one wonders, are the comparisons with journalists, registered nurses, assistant district attorneys, FBI agents, military officers, and other not-so-highly compensated professionals and public-sector employees? Shouldn’t the average pay of a high-school English teacher be compared with that of writers and editors? One could make a case that the salaries of high-school physics or calculus teachers should bear some resemblance to those of computer system analysts, but does the AFT believe that the appropriate compensation benchmarks for 3rd-grade teachers are the salaries of engineers or attorneys?

Nevertheless, data from the NEA and AFT are highly influential. Indeed, the U.S. Department of Education collects few data of its own on this matter. For the most part it simply recycles these union data in publications like the Digest of Education Statistics 2001, a standard reference in which five of the six tables on teacher pay are based on union figures. On the whole, such data present a fairly accurate picture of teacher salaries at the national level and have some value for state-to-state comparisons. Yet they suffer from severe limitations when interest groups, policymakers, and pundits use them to make a point about how the nation values public school teachers.

Summers Off

One facet of teaching that the NEA and AFT, in their data and in their public pronouncements, routinely fail to account for is the shorter workday and work year. In public schools, the median number of school days is 180 per year. Add half-a-dozen or so workdays for parent conferences, professional development, and planning, and the annual work year for most teachers is still shorter than 190 days. By comparison, an accountant or lawyer with two weeks of paid vacation and ten holidays or personal days will work 240 days annually—nearly 30 percent more days per year than public school teachers.

The typical teacher also has a shorter on-site workday than most other professionals. On average, teachers report being in school for fewer than 38 hours per week. This number rises to 40 hours if largely voluntary after-school activities such as coaching or club sponsorship are included. In fact, language limiting the number of hours that teachers are required to be in school is common in their collective-bargaining agreements, particularly in urban school districts. In the just-expired New York City teachers’ contract, the contractual workday was just 6 hours and 20 minutes (including a 50-minute duty-free lunch). The new contract extends the workday by 20 minutes. In Chicago, the limit is 6 hours and 45 minutes, including a 45-minute duty-free lunch.

Of course, many teachers put in nights and weekends at home grading papers and planning for the next week. However, a job that permits relatively more work at home is typically more attractive (particularly to women with children) than one that requires a similar amount of work time on site. And many other professionals bring their work home as well.

The combination of a shorter workday and work year means that the annual hours on the job for teachers are much shorter than in comparable professions. Consider Figure 1, which shows hourly rates of pay computed by the Bureau of Labor Statistics for a variety of occupations. By these calculations, only engineers, architects, and surveyors in private practice and attorneys earn more than teachers on an hourly basis.

The shorter workdays and work year make teaching an attractive occupation to those who wish to balance work and family needs. The shorter hours are especially helpful to women who want both a rewarding career and children, which helps to explain why roughly 75 percent of teachers are women and the share is increasing. An additional plum is that the on-site teaching hours match the schedule of a teacher’s own school-age children. In short, when the kids are at home, so is mom (or dad).

Consider the “sick kid” challenge. In many professions it is very difficult to take unscheduled time off for a sick child or other family emergencies. In teaching, however, the “substitute teacher” solution is a routine part of school life. Indeed, in collective-bargaining negotiations, school administrators frequently complain of excessive absences among teachers. According to a recent U.S. Department of Education survey, during the 1999-2000 school year, 5.2 percent of teachers were absent on any given day on average. That translates into 9.4 days out of a 180-day school year. During the 2000-01 school year in New York City, the annual rate of absences reached 11.3 days per teacher. These rates are much higher than in other executive or professional employment. The Bureau of Labor Statistics reports that the absentee rate for managerial and professional employees is just 1.7 percent of annual hours.

Teaching is also family friendly in the sense that little or no out-of-town travel is required for successful job performance. Teachers may choose to attend out-of-town conferences, but such travel is unusual and not a condition of employment. Although I am not aware of any systematic data collected on this topic, out-of-town travel seems to be commonplace for many young professionals.

The expansion of opportunities for women during the past half-century is supposed to have lessened the attraction of teaching. And yes, the earnings of college-educated women in other fields have grown faster than the earnings of teachers in recent decades. However, the mix of nonteaching jobs that college-educated women hold has changed as well. In 1960, 58 percent of college-educated women not employed as teachers worked as secretaries or other clerical workers, and only 13 percent were “managers.” By 1990 the clerical share had fallen to 30 percent while the share of managers increased to 35 percent (as did the shares of lawyers, accountants, and doctors). This shift from clerical to managerial and professional employment resulted in an increase in nonteaching earnings, but it also meant longer workdays and work weeks, greater responsibility (and stress), and, probably, less flexibility compared with teaching.

The bottom line is that teaching remains a job that makes it easier for parents to reconcile a career and family. Consequently we would expect female teachers to have more children—which is exactly what we see: among college-educated women aged 40 and younger, the average teacher had 2.1 children, versus 1.7 for other occupations. Of course, some of this difference may simply reflect the fact that teaching attracts women who like children and who would have been predisposed to have more children anyway. However, the fact remains that teaching is a profession that makes it less costly for these women to act on their preferences……

One should remember that this pay rate to teachers varies from state to state, for instance:

High Paying State and Low Paying State

  • Teacher pay, as mentioned earlier, varies a lot depending on which state you teach in. California ranks number 1 in teacher pay with an average pay of $63,640. South Dakota ranks number 50 in average teacher pay with an abysmal $35,378.

The reality is that unions are a big part of the problem, not the teachers individually, but corporately.

The problem is not money!

Real spending per pupil ranges from a low of nearly $12,000 in the Phoenix area schools to a high of nearly $27,000 in the New York metro area. The gap between real and reported per-pupil spending ranges from a low of 23 percent in the Chicago area to a high of 90 percent in the Los Angeles metro region.

To put public school spending in perspective, we compare it to estimated total expenditures in local private schools. We find that, in the areas studied, public schools are spending 93 percent more

[….]

The Washington metro area comes in second highest in spending for our study at an average $22,400 per pupil (Figure 3). Only New York tops that figure.28 This real perpupil spending figure is 34 percent higher than the average of $16,700 stated by the school districts. Real public school spending is also more than double the estimated median private school spending of $11,000. The District of Columbia, at over $28,000 per student, has the highest spending of the three DC–area districts we examined. This real spending figure is 61 percent higher than the official one—the largest gap of any district in the area. Arlington comes in second place, spending just under $24,000 per student. And Prince George’s spends the least of the three, at just over $15,000 per pupil

[….]

The New York metro area has the highest average real per-pupil spending among the metro areas in this study, and the average real per-pupil spending figure of more than $26,900 is 44 percent higher than the average of $18,700 that the districts claim to spend (Figure 5).36 Real public school spending is almost 155 percent higher than the estimated…

(POLICY ANALYSIS – CATO INSTITUTE)

For a longer, more in-depth discussion on this topic, see C-SPAN’S video, but here is a snippet from JOHN STOSSLE:

For a more updated look at the numbers, see AEI’S report: Debunking The Myth Of The ‘Teacher Pay Gap,’ Again

A Newsbusters Update:

But as conservative Boston-area talk show host Michael Graham argued in today’s Boston Herald, Damon’s wrong both about the quality of teacher pay and the importance of economic incentives:

Sorry, Matt, but if I were your math teacher back at Cambridge Rindge and Latin, I’d have to give you an F. Wrong on theory and fact.

First the data — starting with Matt’s myth that teachers work for a shi— . . .  er, “less-than-adequate” salary.

According to the Massachusetts Department of Elementary and Secondary Education, the average Boston teacher earned around $80,000 last year. That was the average. And that doesn’t include the generous health care or pension benefits, which would equal $100,000 in the private sector. All for just 180 days of work.

Nationally, the average teacher salary is significantly lower — $53,000. But a teacher still earns more by herself (and about 75 percent of K-12 teachers are women) than the household income of the average American family. Once again, with summers and holidays off.

That fact is important because when you break down what teachers earn per hour, the average teacher is better paid ($30.52) than the average computer programmer ($21.27) or architect ($27.71).

So Damon is wrong on the numbers. And his theory is even worse. Modern economic theory is based on the premise of incentives. Damon’s position that incentives don’t affect behavior puts him in the fiscal Flat Earth Society. He’s the equivalent of an economic creationist.

Of course people work harder if they believe it will pay off. Naturally people slack off otherwise.

Nobody denies this is true of cabbies, car salesmen or newspaper columnists — why wouldn’t it be true of teachers?

Oh, that’s right: “Teachers want to teach.” They’re above worldly concerns like pay and job security. Which some teachers are.

But isn’t it likely that others have more materialistic motivations? Like the fact that it’s a great way for underachievers to prosper?

“Slackers wanting to earn the country’s easiest college major, should major in education,” reports Lynn O’Shaughnessy of CBS’s Moneywatch. “It’s easy to get ‘A’s’ if you’re an education major.”

Which is good news for education majors who, according to O’Shaughnessy, “enter college with the lowest average SAT scores.”

Damon wants us to believe this all-but-guaranteed lifetime employment has no impact on performance? Nobody’s a good enough actor to sell that.

So if you’re a “slacker” who wants to earn more than your brother the accountant, the public schools have got a deal for you!

And once you’re in, you’re in. If you’ve seen “Waiting for Superman,” you know that while one of every 57 doctors loses his license and one out of 97 lawyers gets disbarred, just one out of 1,000 teachers gets fired from big-city school systems for performance issues.

Damon wants us to believe this all-but-guaranteed lifetime employment has no impact on performance? Nobody’s a good enough actor to sell that.

Now that, Ms. Gibson, is how you school someone.

…(read more)…

Part of the issue as well is that unions merely want to hire more and protect existing jobs of teachers and administrators… not take care of students learning ability. As an example of this we see the hiring practices of these unionized organizations:

Which brings to mind these two great short videos:

Who poses the biggest threat to America’s economy by striking deals with crooked politicians? Big Oil, Big Pharma, or Big Unions? Daniel DiSalvo, political science professor at the City College of New York, gives the answer.