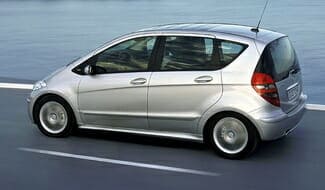
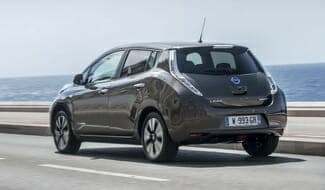
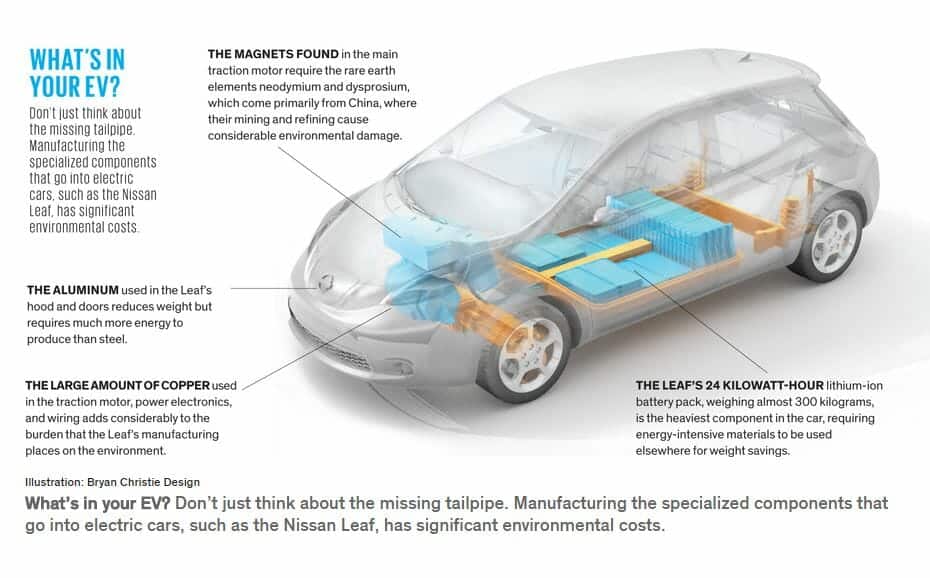
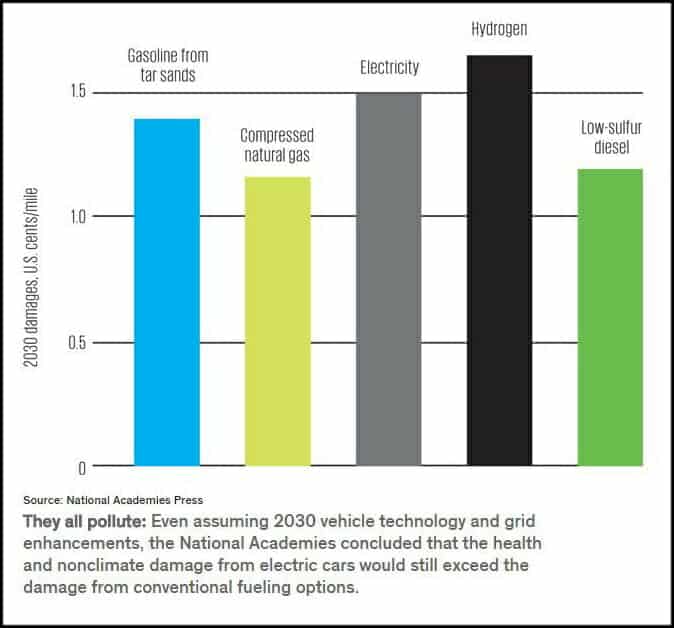
(MEDIA FILES UPDATED 8-28-2022) This is part five of a conversation at a friends house on Christmas. This conversation included: CO2; Rising Oceans; Year 2014 Being the Hottest; Polar Bear Fraud. LOMBORG BOTTOM LINE: Typical gasoline-powered auto engines are approximately 27% efficient. Typical fossil-fueled generating stations are 50% efficient, transmission to end user is 67% efficient, battery charging is 90% efficient and the auto’s electric motor is 90% efficient, so that the fuel efficiency of an electric car is also 27%. However, the electric car requires 30% more power per mile traveled to move the mass of its batteries. (See more here) GREEN ENERGY GRID But manufacturing the famous gasoline-electric hybrid can be a dirty business. Toyota studied the car’s total environmental impact from factory to junkyard. In fact, when looking at the “materials manufacturing” phase of the car’s life cycle, the Prius was worse than the class average across all five emissions categories. (AUTO SPIES) Also, this from Reuters a few years back to put an emphasis on Dr. Lomborg’s $44 dollars of savings subsidized with $7,500 in tax-payers monies: (REUTERS) – General Motors Co. sold a record number of Chevrolet Volt sedans in August — but that probably isn’t a good thing for the automaker’s bottom line. Nearly two years after the introduction of the path-breaking plug-in hybrid, GM is still losing as much as $49,000 on each Volt it builds, according to estimates provided to Reuters by industry analysts and manufacturing experts. Cheap Volt lease offers meant to drive more customers to Chevy showrooms this summer may have pushed that loss even higher. There are some Americans paying just $5,050 to drive around for two years in a vehicle that cost as much as $89,000 to produce…. SO, to be clear… it requires A LOT MORE energy to produce the electric or hybrid car, and takes more energy to “fuel” them. From Lomborg’s USA TODAY editorial: It is time to stop our green worship of the electric car. It costs us a fortune, cuts little CO2 and surprisingly kills almost twice the number of people compared with regular gasoline cars. Electric cars’ global-warming benefits are small. It is advertised as a zero-emissions car, but in reality it only shifts emissions to electricity production, with most coming from fossil fuels. As green venture capitalist Vinod Khosla likes to point out, “Electric cars are coal-powered cars.” The most popular electric car, a Nissan Leaf, over a 90,000-mile lifetime will emit 31 metric tons of CO2, based on emissions from its production, its electricity consumption at average U.S. fuel mix and its ultimate scrapping. A comparable diesel Mercedes CDI A160 over a similar lifetime will emit 3 tons more across its production, diesel consumption and ultimate scrapping. [….] Comparing Apples to Apples [….] Yes, in both cases the electric car is better, but only by a tiny bit. Avoiding 3 tons of CO2 would cost less than $27 on Europe’s emissions trading market. The annual benefit is about the cost of a cup of coffee. Yet U.S. taxpayers spend up to $7,500 in tax breaks for less than $27 of climate benefits. That’s a bad deal. (See also WUWT, where Lomborg notes that “…large battery pack [cars]… avoids nothing or even *increases* total CO2 emissions”) This post will deal with two areas, the main one will be to simply compare the lifetime environmental impact of electric cars to regular gas cars and diesel cars and their carbon footprint. I will add some newer information here as well as combining some older posts herein. The second part is simple, where does the energy come to charge these Electric Vehicles (EVs). SUBSIDY for CARS These subsidies mainly benefit the rich, Tesla’s increased sales are directly linked to tax breaks offered to the wealthy on the backs of gas and diesel drivers: …This means that CDA leader Sybrand Buma’s comments that ‘prosecco-drinking Tesla drivers’ have profited from the tax break at the ‘expense of the ordinary man in the street’ are largely true, the paper said. It points out that the subsidies for electric cars are mainly funded by higher taxes paid by petrol and diesel car owners… Follow the sources below to subsidy sites in purchasing an electric vehicle: California just put another $116 million toward clean vehicle rebates (source)…. Administered by CSE for the California Air Resources Board, the Clean Vehicle Rebate Project (CVRP) offers up to $15,000 in electric vehicle rebates for the purchase or lease of new, eligible zero-emission and plug-in hybrid light-duty vehicles (source). A side note. California, as a government, does not make money like a normal business. It CAN ONLY tax people to get the money it spends. If it gets money from the Federal government, THEY [the Federal government] can only tax people or print money [weakening the dollar if it does this too much]. So, this $116-million comes from somewhere, and, is really just a redistribution of peoples money to an area the State thinks is important ~ but! is in fact, based on bad science. TOYOTA SAYS! So let’s start with some Prius examples. AUTOMOTIVE NEWS documents a study done by Toyota that bursts greenies bubbles: The Toyota Prius is among the greenest cars to operate. But manufacturing the famous gasoline-electric hybrid can be a dirty business. Toyota studied the car’s total environmental impact from factory to junkyard. Not surprisingly, the fuel-efficient Prius was better than average in its class of vehicles in lifetime emissions of carbon dioxide, nitrogen oxide and sulfur oxide, according to Toyota. But it was slightly worse than average in emissions of nonmethane hydrocarbons and particulate matter. Toyota says this is because producing hybrid-only parts such as motors, inverters and nickel-metal hydride batteries consumes more energy and creates more emissions. In fact, when looking at the “materials manufacturing” phase of the car’s life cycle, the Prius was worse than the class average across all five emissions categories. One proponent (now detractor) of EVs is Dr. Ozzie Zehner who has written quite fairly on the issue of alternative energy, and has an open chapter in his book for people to read. The following is via HotAir: …An environmental activist who once pushed for EVs and now works as a visiting scholar at UC Berkeley now calls electric vehicles “unclean at any speed” in a recent article for the engineering journal IEEE Spectrum (via Weasel Zippers and UPI): The idea of electrifying automobiles to get around their environmental shortcomings isn’t new. Twenty years ago, I myself built a hybrid electric car that could be plugged in or run on natural gas. It wasn’t very fast, and I’m pretty sure it wasn’t safe. But I was convinced that cars like mine would help reduce both pollution and fossil-fuel dependence. I was wrong. I’ve come to this conclusion after many years of studying environmental issues more deeply and taking note of some important questions we need to ask ourselves as concerned citizens. Mine is an unpopular stance, to be sure. The suggestive power of electric cars is a persuasive force—so persuasive that answering the seemingly simple question “Are electric cars indeed green?” quickly gets complicated. Ozzie Zehner, who worked on the experimental EV-1 at GM before it got shelved, says some of the complications are due to the economics of science and scientific research. Most of the funding comes from interested parties, which tends to produce research that supports their positions… The article HotAir references is actually really long, well balanced, and informative. I suggest the serious reader delve in as “Unclean At Any Speed” touches on the many aspects of the alternative energy push right now. One aspect noted in the article is the large rare-earth metals needed (mined) and energy used in the extraction of these and the destruction of large swaths of land mass in order to produce the batteries and magnets involved in EVs. Prius vs. Hummer I will combine a graphic from Dr. Zehner article with another noted study comparing the Prius to a Hummer (the better comparison will come later with a diesel and electric cars): (click to enlarge) Some have called the Hummer/Prius comparison into question, some of which is even hashed out in the comment section of the post where the bullet points are from, fine. (A diesel Hummer H2 would surely beat the total lifespan footprint of the comparison.) But the impact on the environment (note the moon-landing stat) and overall comparisons to diesel’s is what interests me. The author of the above article updated his post with this [for the curious]: UPDATE: Apparently the Prius was only ranked #12 in overall green-ness, behind several diesels, city roadsters, and smart cars. Experts expect the ranking to be even worse next year. See also SCIENTIFIC AMERICAN’S article entitled: “Electric Cars Are Not Necessarily Clean: Your battery-powered vehicle is only as green as your electricity supplier“ This brings me to another idea noted in the aforementioned article, even given a growth pattern in alternative fuels diesel in 2030 is still projected to be the best in low impact on the environment: Environmental Impact This is an area that might be surprising. At face value, with high gas mileage and low emissions, hybrids seem like the easy answer. But as we have previously covered at Digital Trends, vehicles with batteries may not be nearly as “green” as is often claimed. This is a complicated issue. Essentially, batteries – particularly lithium-ion batteries – are both incredibly energy intensive and also toxic to produce. This means that the carbon footprint for hybrid production is much larger than a gasoline-only or even diesel-powered car. In fact, according to some studies, fully electric vehicles have a bigger carbon footprint than diesel powered vehicles in areas where most electricity is produced using fossil fuels. Modern diesel-cars should not be compared with truck engines that blast clouds of panda-killing soot into the air. Thanks to improvements in technology, current diesel cars are comparable in terms of particulate emissions to any other gasoline-powered car. In fact Volkswagen and Audi’s clean diesel technology makes cars like the Passat TDI cleaner than 93 percent of other cars on the road. As with price, there will be specific exceptions to this rule, but diesel is greener than hybrid technology. Solar/Wind Energy Environmental Impact So diesel hybrids are the ideal for those concerned about the environment. But the rare-earth metals and substances used to make the batteries and magnets are in much less supply than coal, oil, and the like. In fact, in the 70’s it was predicted that we would be running dry of oil this year, but in fact we have at least 200-years worth of supply, the highest ever in the history of man (see point #3). To be clear, the impact on land and energy to get these materials is worse than normal automotive choices: This section is a response of sorts to Dr. Lomborg, who is interviewed in the opening video. And it is very simple, alternative energy sources create more pollution than they will save (carbon footprint wise). WIND Wind farms will create more carbon dioxide, say scientists Thousands of Britain’s wind turbines will create more greenhouse gases than they save, according to potentially devastating scientific research to be published later this year. The finding, which threatens the entire rationale of the onshore wind farm industry, will be made by Scottish government-funded researchers who devised the standard method used by developers to calculate “carbon payback time” for wind farms on peat soils. Wind farms are typically built on upland sites, where peat soil is common. In Scotland alone, two thirds of all planned onshore wind development is on peatland. England and Wales also have large numbers of current or proposed peatland wind farms. But peat is also a massive store of carbon, described as Europe’s equivalent of the tropical rainforest. Peat bogs contain and absorb carbon in the same way as trees and plants — but in much higher quantities. British peatland stores at least 3.2 billion tons of carbon, making it by far the country’s most important carbon sink and among the most important in the world. Wind farms, and the miles of new roads and tracks needed to service them, damage or destroy the peat and cause significant loss of carbon to the atmosphere, where it contributes to climate change. [….] “This is just another way in which wind power is a scam. It couldn’t exist without subsidy. It is driving industry out of Britain and driving people into fuel poverty.”… Wind power cannot meet demands, and are dependent on weather conditions, as the above graph shows. Here is a snippit of the issue at hand with Germany’s electric grid: You can see the extreme volatility of wind power. Such volatility plays havoc with the electric grid and makes fossil fuel backup generation more expensive to run because it must constantly change production rate; it cannot be run efficiently. Those constant changes cause production of more emissions than would be produced without having to contend with the quirky wind power contribution. Gosselin (a US citizen living in Germany, who received a Bachelor of Science in Mechanical Engineering at the University of Arizona) notes that “Resistance to wind power in Germany is snowballing.” “The turbines, which the German government says will become the ‘workhorse’ of the German power industry, ran at over 50% of their rated capacity only for 461 hours [out of a possible 8,766], or just 5.2% of the time.” In addition to the unreliable power produced by allegedly “green” wind power, it is becoming increasingly obvious that wind generation is taking a large toll on wildlife and has deleterious effects on human health. [….] “The U.S. Fish and Wildlife Service (FWS) and American Bird Conservancy say wind turbines kill 440,000 bald and golden eagles, hawks, falcons, owls, cranes, egrets, geese and other birds every year in the United States, along with countless insect-eating bats. Wind turbines killed 600000 bats last year. “Renewable energy technologies simply won’t work; we need a “We get a tax credit if we build a lot of wind farms. “Suggesting that renewables will let us phase rapidly off fossil (LINK TO ARTICLE IN POWER PLANT PICS) Put another way: “A fundamental principle of information theory is that you can’t guarantee outcomes… in order for an experiment to yield knowledge, it has to be able to fail. If you have guaranteed experiments, you have zero knowledge” ~ George Gilder Interview by Dennis Prager {Editors note: this is how the USSR ended up with warehouses FULL of “widgets” (things made that it could not use or people did not want) no one needed in the real world. This economic law enforcers George Gilder’s contention that when government supports a venture from failing, no information is gained in knowing if the program actually works. Only the free-market can do this. [See my post on Capitalism.]} Wind power, in fact, pollutes the environment in a much more thorough manner… Via Independent IE “Technology” page: ….But on huge wind farms the motion of the turbines mixes the air higher in the atmosphere that is warmer, pushing up the overall temperature. Satellite data over a large area in Texas, that is now covered by four of the world’s largest wind farms, found that over a decade the local temperature went up by almost 1C as more turbines are built. This could have long term effects on wildlife living in the immediate areas of larger wind farms. It could also affect regional weather patterns as warmer areas affect the formation of cloud and even wind speeds. It is reported China is now erecting 36 wind turbines every day and Texas is the largest producer of wind power in the US. Liming Zhou, Research Associate Professor at the Department of Atmospheric and Environmental Sciences at the University of New York, who led the study, said further research is needed into the affect of the new technology on the wider environment. “Wind energy is among the world’s fastest growing sources of energy. The US wind industry has experienced a remarkably rapid expansion of capacity in recent years,” he said. “While converting wind’s kinetic energy into electricity, wind turbines modify surface-atmosphere exchanges and transfer of energy, momentum, mass and moisture within the atmosphere. These changes, if spatially large enough, might have noticeable impacts on local to regional weather and climate.” The study, published in Nature, found a “significant warming trend” of up to 0.72C (1.37F) per decade, particularly at night-time, over wind farms relative to near-by non-wind-farm regions. The team studied satellite data showing land surface temperature in west-central Texas…. ….According to Prinn and Wang, this temperature increase occurs because the wind turbines affect two processes that play critical roles in determining surface temperature and atmospheric circulation: vertical turbulent motion and horizontal heat transport. Both processes are responsible for moving heat away from Earth’s surface. In the analysis, the wind turbines on land reduced wind speed, particularly on the downwind side of the wind farms, which reduced the strength of the turbulent motion and horizontal heat transport processes. This resulted in less heat being transported to the upper parts of the atmosphere, as well as to other regions farther away from the wind farms…. Via Gateway Pundit, and the part on birds is found here: Not only do wind farms kill off high-profile bird species like golden and bald eagles and California condors, the farms also cause global warming. After hundreds of millions in blown taxpayer money and thousands of dead birds the latest research shows that wind farms cause warming. Reuters reported, via Free Republic: Large wind farms might have a warming effect on the local climate, research in the United States showed on Sunday, casting a shadow over the long-term sustainability of wind power… …The world’s wind farms last year had the capacity to produce 238 gigawatt of electricity at any one time. That was a 21 percent rise on 2010 and capacity is expected to reach nearly 500 gigawatt by the end of 2016 as more, and bigger, farms spring up, according to the Global Wind Energy Council. Researchers at the State University of New York at Albany analysed the satellite data of areas around large wind farms in Texas, where four of the world’s largest farms are located, over the period 2003 to 2011. The results, published in the journal Nature Climate Change, showed a warming trend of up to 0.72 degrees Celsius per decade in areas over the farms, compared with nearby regions without the farms. “We attribute this warming primarily to wind farms,” the study said. The temperature change could be due to the effects of the energy expelled by farms and the movement and turbulence generated by turbine rotors, it said. “These changes, if spatially large enough, may have noticeable impacts on local to regional weather and climate,” the authors said. But the Democrats will continue to dump billions into the costly energy source anyway. It makes them feel good.
fundamentally different approach.” – Top Google engineers
That’s the only reason to build them. They don’t make
sense without the tax credit.” – Warren Buffett
fuels in the United States, China, India, or the world as a whole
is almost the equivalent of believing in the Easter Bunny and Tooth Fairy.”
– James Hansen (The Godfather of global warming
alarmism and former NASA climate chief)
Can you imagine the polluted, destroyed world we would have if the left had their way with green energy?
Environazis, like all progressives, care about two things: other people’s money and the power entailed in imposing their ideology. Prominent among the many things they do not care about is the environment, as demonstrated by a monstrosity planned for Loch Ness:
A giant 67 turbine wind farm planned for the mountains overlooking Loch Ness will be an environmental disaster thanks to the sheer quantity of stone which will need to be quarried to construct it, according to the John Muir Trust. In addition, the Trust has warned that the turbines spell ecological disaster for the wet blanket peat-land which covers the area and acts as a huge carbon sink, the Sunday Times has reported.
According to global warming dogma, carbon sinks are crucial in preventing human activity from causing climatic doom.
The planet isn’t the only victim of this ideologically driven enterprise:
Around one million people visit the picturesque Loch Ness, nestled in the highlands of Scotland each year, bringing about £25 million in revenue with them. Most are on the lookout for the infamous monster, but if Scottish and Southern Energy (SSE) get their way the tourists will have something else to look at: the Stronelairg wind farm – 67 turbines, each 443ft high, peppered across the Monadhlaith mountains overlooking the Loch.
- Is “green” energy, particularly wind and solar energy, the solution to our climate and energy problems? Or should we be relying on things like natural gas, nuclear energy, and even coal for our energy needs and environmental obligations? Alex Epstein of the Center for Industrial Progress explains.
NEW INFORMATION on the low frequency noise made by wind farms shows a direct connection to the health of ones heart.
Interviewed in Allgemeine-Zeitung, Vahl said that the Low Frequency Noise generated by wind turbines can weaken the heart muscle and change the blood flow.
According to NO TRICKS ZONE:
Prof. Wahl became interested in infrasound and its impact on health after a friend who lived near a wind park had complained of feeling continuously sick. It is known that all around the world people living near wind parks often experience health issues – some being severe.
The group led by Prof. Vahl conducted an experiment to find out if infrasound has an effect on heart muscle strength. Under the measurement conditions, the force developed by isolated heart muscle was up to 20 percent less.
The strength of the heart muscle is important in the event the aortic valve becomes caked up and thus more narrow. According to Dr. Vahl: “This changes the blood flow and the flow noise.”
Now researchers are discussing whether these changes can pose an additional risk to the function of the heart, the Allgemeine Zeitung reported.
Citing the results, Prof. Vahl said: “The fundamental question of whether infrasound can affect the heart muscle has been answered.”
The researchers conclude: “We are at the very beginning, but we can imagine that long-term impact of infrasound causes health problems. The silent noise of infrasound acts like a heart jammer.”
There has long been anecdotal evidence that wind turbines are injurious to human health. I first heard these stories myself on a visit to Australia in 2012 when I met several people who had experienced serious health problems from the effects of wind turbine infrasound – and had been forced to abandon their homes. Subsequently, I also spoke to people in the UK who were also victims of Wind Turbine Syndrome.
- You can read the first report I wrote on the subject here.
- Here is a more recent one, full of useful links, titled: Donald Trump is so Right to Wage War on Wind Farms
The wind industry is a massive class action suit waiting to happen. [Especially now that the World Health Organisation has confirmed the health risks – which, of course, just like Big Tobacco, Big Wind has been covering up for years] Indeed, of all the scandals to emerge from the great global warming scam, the wind industry is in my view the worst….
This realization has hit Google scientists squarely in the common sense thinking center. Google (and Apple) had grand dreams of going 100%-powered by alternative means. They have all but given up:
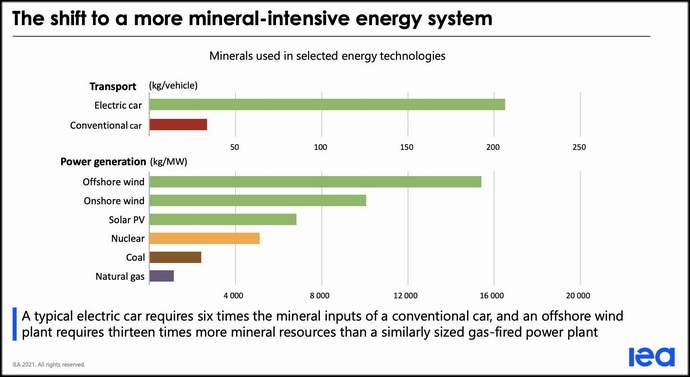
“Even if one were to electrify all of transport, industry, heating and so on, so much renewable generation and balancing/storage equipment would be needed to power it that astronomical new requirements for steel, concrete, copper, glass, carbon fibre, neodymium, shipping and haulage etc etc would appear. All these things are made using mammoth amounts of energy: far from achieving massive energy savings, which most plans for a renewables future rely on implicitly, we would wind up needing far more energy, which would mean even more vast renewables farms – and even more materials and energy to make and maintain them and so on. The scale of the building would be like nothing ever attempted by the human race.”
I must say I’m personally surprised at the conclusion of this study. I genuinely thought that we were maybe a few solar innovations and battery technology breakthroughs away from truly viable solar power. But if this study is to be believed, solar and other renewables will never in the foreseeable future deliver meaningful amounts of energy.
Solar
Low-Tech Magazine notes that new “research shows, albeit unintentional, that generating electricity with solar panels can also be a very bad idea. In some cases, producing electricity by solar panels releases more greenhouse gases than producing electricity by gas or even coal.” Continuing, they point out that…
Producing electricity from solar cells reduces air pollutants and greenhouse gases by about 90 percent in comparison to using conventional fossil fuel technologies, claims a study called “Emissions from Photovoltaic Life Cycles”, to be published this month in “Environmental Science & Technology”. Good news, it seems, until one reads the report itself. The researchers come up with a solid set of figures. However, they interpret them in a rather optimistic way. Some recalculations (skip this article if you get annoyed by numbers) produce striking conclusions.
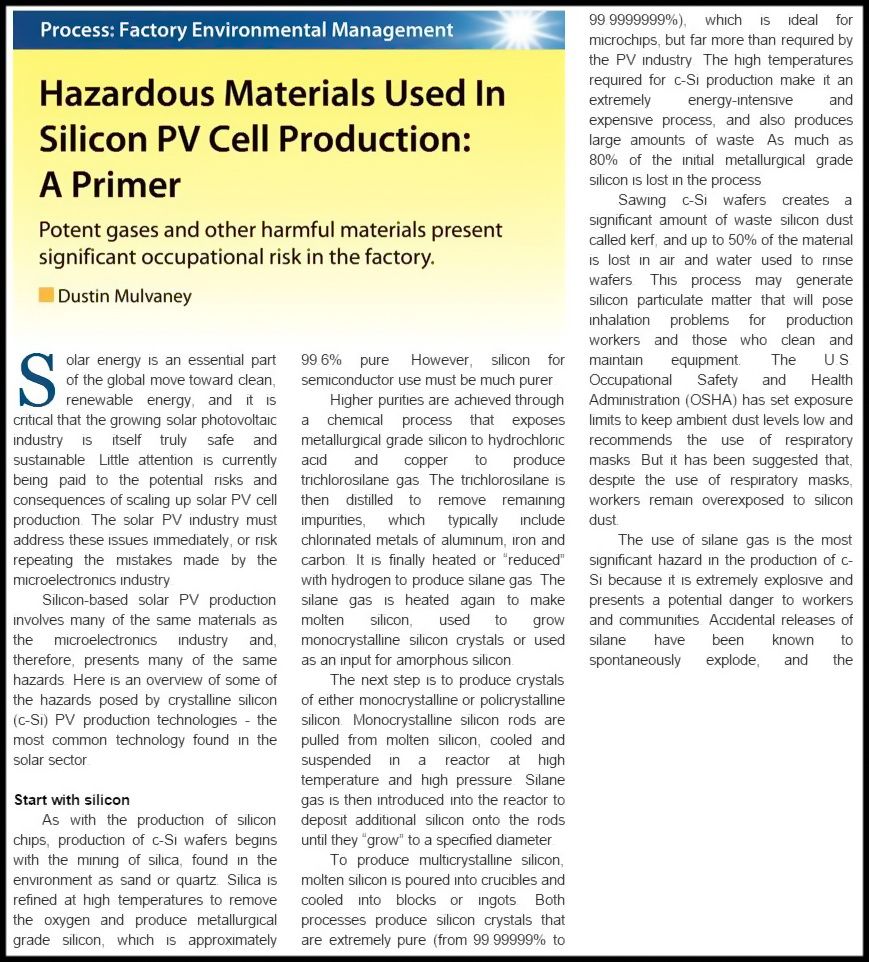
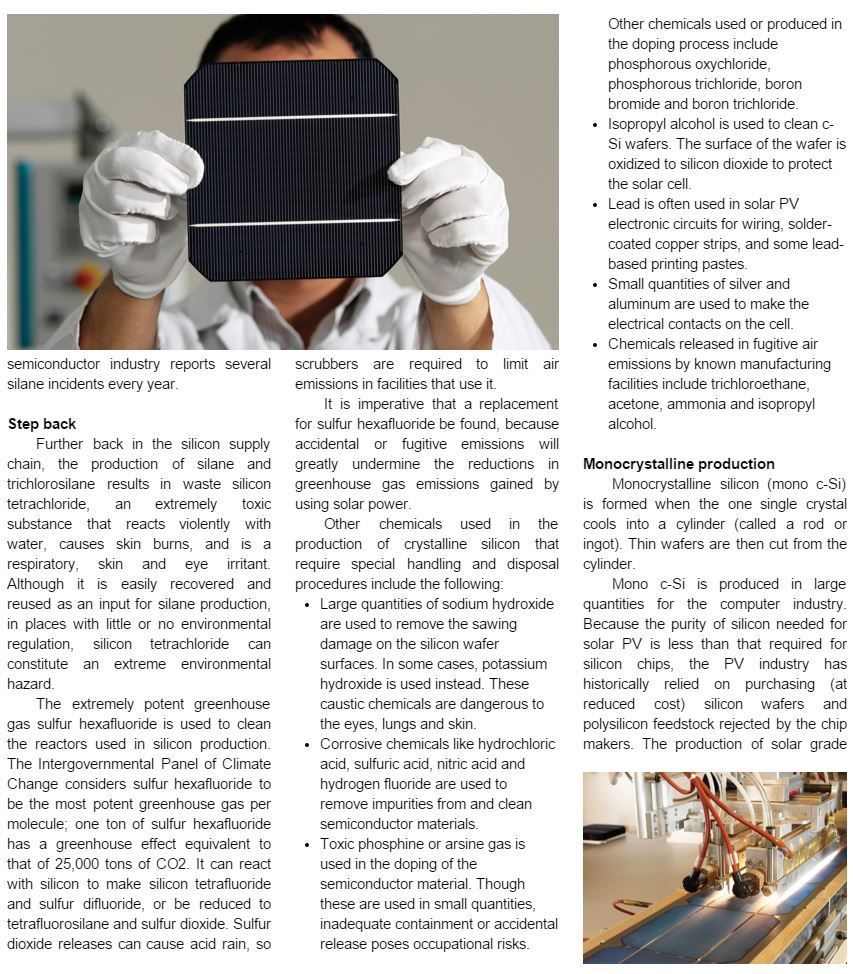
Solar panels don’t come falling out of the sky – they have to be manufactured. Similar to computer chips, this is a dirty and energy-intensive process. First, raw materials have to be mined: quartz sand for silicon cells, metal ore for thin film cells. Next, these materials have to be treated, following different steps (in the case of silicon cells these are purification, crystallization and wafering). Finally, these upgraded materials have to be manufactured into solar cells, and assembled into modules. All these processes produce air pollution and heavy metal emissions, and they consume energy – which brings about more air pollution, heavy metal emissions and also greenhouse gases.
Similarly, Solar Industry Magazine notes that this process is very caustic:

There are also practical dangers to the first res ponders as well:
So an electrical grid powered by alternative fuels or “renewable energy is really a pipe-dream. Take the projections of that giant bird killing plant on the California-Nevada border:
….A solar power plant in the Mojave Desert that’s attracted negative attention for its injuries to birds is producing a whole lot less power than it’s supposed to, according to Energy Department figures.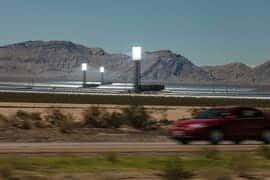
According to stats from the U.S. Energy Information Administration, a number-crunching branch of the U.S. Department of Energy, the Ivanpah Solar Electric Generating System in San Bernardino County has produced only about a quarter of the power it’s supposed to, with both less than optimal weather and apparent mechanical issues contributing to the shortfall.
[….]
As Danko points out, Ivanpah’s owners have recently sought extensions on the repayment schedule for the $1.6 billion in government-backed loans that paid for Ivanpah’s construction, hoping to delay writing checks until the firms can secure a government grant they hope to use to pay down the loan… .
(SEE MORE)
BATTERIES
In an excellent post linking to a German documentary (30-minutes) and study showing the devastation to Chili of lithium mining, we find the following:
German ZDF public television recently broadcast a report showing how electric cars are a far cry from being what they are all cracked up to be by green activists.

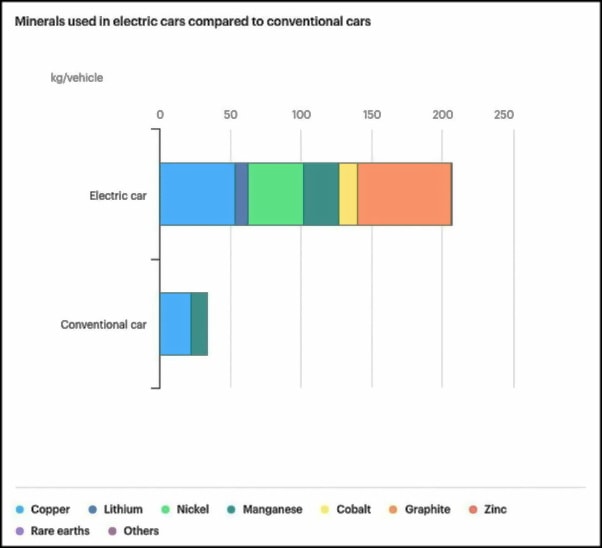
The report titled: “Batteries in twilight – The dark side of e-mobility” [now not available] shows how the mining of raw materials needed for producing the massive automobile batteries is highly destructive to the environment. For example, two thirds of the cobalt currently comes from the Congo, where the mining rights have been acquired by China. Other materials needed include manganese, lithium and graphite.
Every electric car battery needs about 20 – 30 kg of lithium.
The mining of the raw materials often takes place in third world countries where workers are forced to work under horrendous conditions and no regard is given to protecting the environment. When it comes to “going green”, it seems everything flies out the window….
- The production of lithium through evaporation ponds uses a lot of water – around 21 million litres per day. Approximately 2.2 million litres of water is needed to produce one ton of lithium. (EURO NEWS)
AGAIN… here is a Facebook post of the same thing regarding Lithium Fields:

This is a Lithium leach field.
This is what your Electric Car batteries are made of.
It is so neuro-toxic that a bird landing on this stuff dies in minutes.
Take a guess what it does to your nervous system?
Pat yourself on the back for saving the environment.
Chile, 2nd largest lithium producer, is having water-scarcity problems as this technology takes so much water to produce battery-grade lithium. 2000 tons: 1 ton.
And the current version of the “inflation reduction act” wants 100% of EV battery components produced in the US.
Lead, nickel, lithium, cadmium, alkaline, mercury and nickel metal hydride.
Batteries are a collection of things that are extremely deadly.
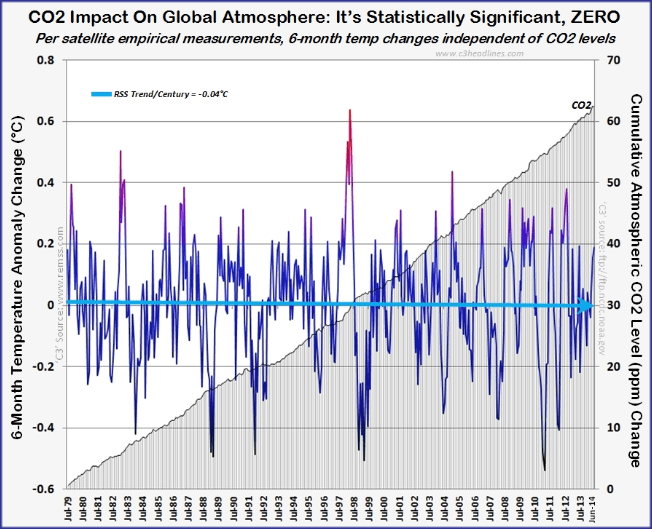
Alternative fuels/energy is a DIRTY BUSINESS… but the left who live in the seclusion of the New York Times and MSNBC would never know this. I can show a graph showing skyrocketing carbon emissions worldwide for the past decade and that the temperature has dropped during this time by a small amount, and it is like showing them instructions to build an IKEA bookcase with instructions written in Gaelic! 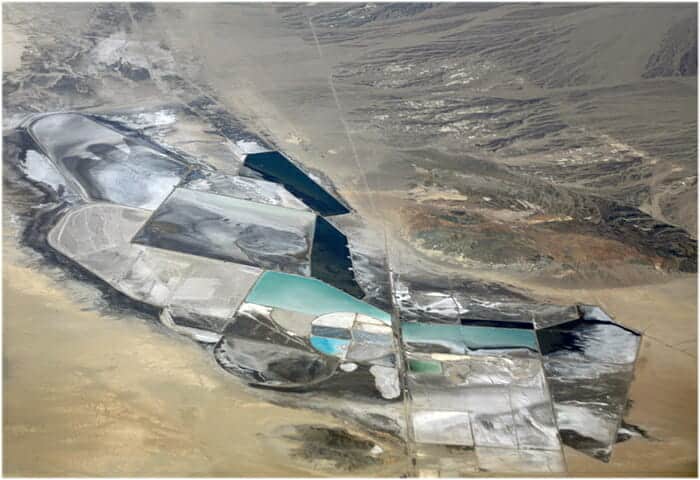
What about the impact and supply of the materials needed to produce batteries? TreeHugger has a good post that mentions some of these environmental pitfalls. These issues involve many devices we use daily (cell phones, lap-top computers, rechargeable batteries, etc.), but add to this burden a mandated or subsidized car industry:
…lithium batteries take a tremendous amount of copper and aluminum to work properly. These metals are needed for the production of the anode & the cathode, cables and battery management systems. Copper and aluminum have to be mined, processes and manufacturing which takes lots of energy, chemicals and water which add to their environmental burden.
[….]
First of all, this study emphasizes that there would be less Lithium available than previously estimated for the global electric car market. It also states the fact that some of the largest concentrations of Lithium in the world are found in some of the most beautiful and ecologically fragile places, such as The Salar de Uyuni in Bolivia. The authors note:
“It would be irresponsible to despoil these regions for a material which can only ever be produced in sufficient quantities to serve a niche market of luxury vehicles for the top end of the market. We live in an age of Environmental Responsibility where the folly of the last two hundred years of despoilment of the Earth’s resources are clear to see. We cannot have “Green Cars” that have been produced at the expense of some of the world’s last unspoiled and irreplaceable wilderness. We have a responsibility to rectify our errors and not fall into the same traps as in the past.”
[….]
The report estimates that there would be less Lithium available than previously estimated for the global electric car market, as demand is rising for competing markets, such as cellular telephones and other electronic devices. At the same time, due to a great concentration of Lithium found in Chile, Bolivia and Argentina (70% of the world’s deposits), the United States and other developed countries needing the material will be subject to geopolitical forces similar to those they have already encountered from the member countries of OPEC…
Click HERE to go to larger file (use mouse wheel to zoom in)

In an excellent article we see the projected demands on other metals involved in the battery and transit goals:
….Regarding the demand for the different minerals, in the case of aluminum, according to our results, the demand for minerals from the rest of the economy would stand out, with the requirement for batteries having little influence. Copper would have a high demand from the rest of the economy, but it would also have a significant demand from vehicles, infrastructure and batteries. Cobalt would be in high demand because of the manufacture of batteries with the exception of the LFP battery that does not have this mineral, in the case of its demand from the rest of the economy it can be stated that it would be important but less influential than the demand for batteries. Lithium would have very high requirements from all the batteries and with a reduced demand from the rest of the economy. Manganese would have an important but contained demand coming from LMO and NMC batteries, since the requirements for this mineral would stand out in the rest of the economy. Finally, nickel would have a high demand from NMC and NCA batteries, but its main demand would come from the rest of the economy.
The batteries that would require the least materials are the NCA and LFP batteries. The NMC battery has been surpassed in performance and mineral usage by the NCA. The LiMnO2 battery has a very poor performance, so it has been doomed to disuse in electric vehicles. In addition, the LFP battery, the only one that does not use critical materials in the cathode (other than lithium), also has poor performance, requiring very large batteries (in size and weight) to match the capacity and power of batteries using cobalt.
Charging infrastructure, rail and copper used in electrified vehicles could add up to more than 17% of the copper reserve requirement in the most unfavourable scenario (high EV) and 7% in the most favourable (degrowth), so these are elements that must be taken into account…..
(GEEDS)
Half of all Cobalt made goes into electric cars.
Are Electric Vehicles really clean? | They run on dirty energy and blood of children as young as 6. | Electric cars drive human rights abuse and child labour. | China is one of the villains in this story. | Are electric carmakers equally guilty too? | Palki Sharma Upadhyay tells you.
Siddharth Kara is an author and expert on modern-day slavery, human trafficking, and child labor. Look for his new book, “Cobalt Red: How the Blood of the Congo Powers Our Lives,” on January 31, 2023
TO MAKE MATTERS WORSE….
…. lithium is also not the only battery ingredient with a dark side. Perhaps the darkest of all is cobalt, which is commonly used, alongside lithium, in the batteries of many electric vehicles.
More than half of the world’s cobalt is mined in the Democratic Republic of the Congo (DRC). According to a 2016 Amnesty International Report, 20% of the cobalt exported from the DRC comes from artisanal mines, in which miners use either their hands or very basic tools to dig out rocks from tunnels deep underground, often for as little as $2 a day.
Worse still, UNICEF estimates 40,000 of the workers in these mines are children under the age of 18, with some as young as 7 years old. Cobalt mining also comes with serious health risks. Chronic exposure to dust containing cobalt can cause the potentially fatal lung disease “hard metal lung disease.” Many fatal accidents have also been caused by mines not being constructed or managed safely.
Clearly then, in the face of such widespread environmental damage and human rights abuses, the ethics of electric vehicles is far more complicated than the expensive car adverts and glowing newspaper headlines would have us believe…..
(VARSITY)
From the video description:
This is pretty lame. I wonder how many people think this power just comes out of the ground? Perhaps these greentards think this is magic solar power that is leached from the sun and stored in invisible floating Tesla flywheels. Bet that went right over most heads. Anyway this is a real problem for shoppers at WalGREENS. Weather they are asked or not they are subsidizing this climate hoax and paying for the fuel that is getting these FARCE-CARS from point “a” to point “b.”
And there are a lot of tax-monies/incentives used even for the above charging stations. Wiki has some pretty good references in regards to this:
Plug-in conversion kits
The 2009 ARRA provided a tax credit for plug-in electric drive conversion kits. The credit is equal to 10% of the cost of converting a vehicle to a qualified plug-in electric vehicle and in service after February 17, 2009. The maximum amount of the credit is $4,000. The credit does not apply to conversions made after December 31, 2011.[142][149]
There was (through 2010) a federal tax credit equal to 50% of the cost to buy and install a home-based charging station with a maximum credit of US$2,000 for each station. Businesses qualified for tax credits up to $50,000 for larger installations.[144][150] These credits expired on December 31, 2010, but were extended through 2013 with a reduced tax credit equal to 30% with a maximum credit of up to US$1,000 for each station for individuals and up to US$30,000 for commercial buyers.[][]
(See more HERE)
CLIMATE/WEATHER
Another factor regarding optimal output and electric vehicles is hot and cold weather. I will let a wonderful WIRED MAGAZINE article explain:
…EV drivers have other factors to consider in winter weather: How far they can go, and how long it will take them to recharge.
Cold temperatures can hurt both, especially when it gets as severe as Winter Storm Jaden, which has triggered states of emergency across the country and will subject more than 70 percent of the US population to subzero temperatures over the next few days. That’s because the lithium-ion batteries that power EVs (as well as cellphones and laptops) are very temperature sensitive.
“Batteries are like humans,” says Anna Stefanopoulou, director of the University of Michigan’s Energy Institute. They prefer the same sort of temperature range that people do. Anything below 40 or above 115 degrees Fahrenheit and they’re not going to deliver their peak performance. They like to be around 60 to 80 degrees. As the temperature drops, the electrolyte fluid inside the battery cells becomes more sluggish. “You don’t have as much power when you want to discharge,” says Stefanopoulou. “The situation is even more limited when you want to charge.”
Modern cars are designed to take that into account, with battery thermal management systems that warm or cool a battery. But while an internal combustion engine generates its own heat, which warms the engine and the car occupants, an EV has to find that warmth somewhere else, either scavenging the small amount of heat that motors and inverters make or running a heater. That takes energy, meaning there’s less power available to move the wheels.
Additionally, to protect the battery—the most expensive component of an EV—the onboard computer may limit how it’s used in extreme low temperatures. The Tesla Model S owners manual warns: “In cold weather, some of the stored energy in the Battery may not be available on your drive because the battery is too cold.”…
In a conversation between EV owners and others at WATTS UP WITH THAT, a comment that sums up the above but in a short paragraph, reads:
- It’s not just bigger, it’s huge. Unlike an IC powered car, where cold weather won’t really affect it much, an electric car is severely disadvantaged. Drop outside temperatures down to -10 degrees F (not uncommon in Chicago) and that 300 mile range drops to 75 miles. Commute 20 miles to work on a frigid winter morning and 20 miles home in slooow traffic in a snowstorm with lights, wipers, and defroster on hi, and you just might not make it.
And another story of Minnessota doo gooders plans failiung them:
The Twin City buses were supposed to go 150 miles on a single charge, but the actual range was closer to 75 miles.
Minnesota cities worked to shift toward clean energy in public transit, but complications from acquired electric vehicles have prompted significant overhauls and additional expenditures to keep the buses operational.
In Duluth, Minn., technicians installed diesel-powered heaters on electric buses as the city’s electric fleet struggled to perform. In 2015, the city received a $6.3 million federal grant, according to MinnPost, for seven battery-electric buses from Proterra, which were delivered in 2018.
Proterra, which went bankrupt in August, sold 550 buses. The company enjoyed outspoken support from the Biden administration, but the buses have given transit districts across the country extensive problems. Many of the buses, which were purchased with sizable federal grants, have broken down, and repairs have been slow going as a result of a lack of parts.
The Proterra buses in Duluth struggled to make it up steep hills and to keep riders warm in winter. Proterra technicians installed diesel-powered heaters on the buses and increased the battery capacity so they could handle steep hills and subzero temperatures, which degrade the performance of electric vehicles.
In the Twin Cities, meanwhile, the transit department received another $1.7 million federal grant for eight more electric buses from Canada-based New Flyer. The Twin City buses were supposed to go 150 miles on a single charge, but the actual range was closer to 75 miles. The buses further failed to meet 20% of their scheduled operating miles because of needed battery replacements. In 2021, the buses were out of service for most of the year because of charging station issues at the garage…..
Reality is a Bitch!
THE DAILY MAIL notes that “[e]lectric cars have 40 per cent less range when the temperature dips below freezing, new research has revealed.” Wow. Canadians are well-aware of the issue — as are the people in the northern states.
IN~OTHER~WORDS, this “venture is a giant boondoggle and these charging-stations would never survive outside of transferring wealth from business owners and those that drive the economy to cover this failure of a “choice.”
AGAIN:
“A fundamental principle of information theory is that you can’t guarantee outcomes… in order for an experiment to yield knowledge, it has to be able to fail. If you have guaranteed experiments, you have zero knowledge” — George Gilder
Interview by Dennis Prager {Editors note: this is how the USSR ended up with warehouses FULL of “widgets” (things made that it could not use or people did not want) no one needed in the real world. This economic law enforcers George Gilder’s contention that when government supports a venture from failing, no information is gained in knowing if the program actually works. Only the free-market can do this. [See my post on Capitalism.]}