In 1966 Time magazine ran a cover story asking: Is God Dead? Many have accepted the cultural narrative that he’s obsolete—that as science progresses, there is less need for a “God” to explain the universe. Yet it turns out that the rumors of God’s death were premature. More amazing is that the relatively recent case for his existence comes from a surprising place—science itself.
Here’s the story: The same year Time featured the now-famous headline, the astronomer Carl Sagan announced that there were two important criteria for a planet to support life: The right kind of star, and a planet the right distance from that star. Given the roughly octillion—1 followed by 24 zeros—planets in the universe, there should have been about septillion—1 followed by 21 zeros—planets capable of supporting life.
With such spectacular odds, the Search for Extraterrestrial Intelligence, a large, expensive collection of private and publicly funded projects launched in the 1960s, was sure to turn up something soon. Scientists listened with a vast radio telescopic network for signals that resembled coded intelligence and were not merely random. But as years passed, the silence from the rest of the universe was deafening. Congress defunded SETI in 1993, but the search continues with private funds. As of 2014, researches have discovered precisely bubkis—0 followed by nothing.
What happened? As our knowledge of the universe increased, it became clear that there were far more factors necessary for life than Sagan supposed. His two parameters grew to 10 and then 20 and then 50, and so the number of potentially life-supporting planets decreased accordingly. The number dropped to a few thousand planets and kept on plummeting.
Even SETI proponents acknowledged the problem. Peter Schenkel wrote in a 2006 piece for Skeptical Inquirer magazine: “In light of new findings and insights, it seems appropriate to put excessive euphoria to rest . . . . We should quietly admit that the early estimates . . . may no longer be tenable.”
As factors continued to be discovered, the number of possible planets hit zero, and kept going. In other words, the odds turned against any planet in the universe supporting life, including this one. Probability said that even we shouldn’t be here.
Today there are more than 200 known parameters necessary for a planet to support life—every single one of which must be perfectly met, or the whole thing falls apart. Without a massive planet like Jupiter nearby, whose gravity will draw away asteroids, a thousand times as many would hit Earth’s surface. The odds against life in the universe are simply astonishing.
Yet here we are, not only existing, but talking about existing. What can account for it? Can every one of those many parameters have been perfect by accident? At what point is it fair to admit that science suggests that we cannot be the result of random forces? Doesn’t assuming that an intelligence created these perfect conditions require far less faith than believing that a life-sustaining Earth just happened to beat the inconceivable odds to come into being?
There’s more. The fine-tuning necessary for life to exist on a planet is nothing compared with the fine-tuning required for the universe to exist at all. For example, astrophysicists now know that the values of the four fundamental forces—gravity, the electromagnetic force, and the “strong” and “weak” nuclear forces—were determined less than one millionth of a second after the big bang. Alter any one value and the universe could not exist. For instance, if the ratio between the nuclear strong force and the electromagnetic force had been off by the tiniest fraction of the tiniest fraction—by even one part in 100,000,000,000,000,000—then no stars could have ever formed at all. Feel free to gulp.
Multiply that single parameter by all the other necessary conditions, and the odds against the universe existing are so heart-stoppingly astronomical that the notion that it all “just happened” defies common sense. It would be like tossing a coin and having it come up heads 10 quintillion times in a row. Really?
Fred Hoyle, the astronomer who coined the term “big bang,” said that his atheism was “greatly shaken” at these developments. He later wrote that “a common-sense interpretation of the facts suggests that a super-intellect has monkeyed with the physics, as well as with chemistry and biology . . . . The numbers one calculates from the facts seem to me so overwhelming as to put this conclusion almost beyond question.”…
This is meant mainly as a supplement to a Christmas Eve-Eve gathering/discussion I was at. I will make this post a little different than other posts, as, it will be “minimalist.” This is the second installment of the topics covered, which are polar bears, rising sea levels, CO2, Inconvenient Truth (the movie), nuclear power, warmest year, electric vehicles (EVs)/hybrid cars, and bullet trains.
Tarzan couldn’t take this kind of hot!
The question becomes this:
WHAT ARE THE DIFFERENT WAYS TO MEASURE TEMPERATURE,
WHICH ONE ARE MANY MEDIA SOURCES USING,
AND WHICH ARE THE MOST RELIABLE.
These are the questions any serious person who tells people 2014 is the hottest year as if they are the final arbiter of truth. I have dealt with this in the past, but will again deal with it here.
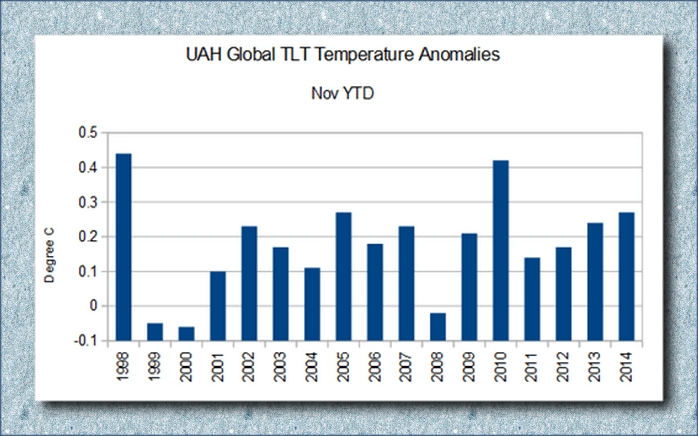
The two main research groups tracking global lower-tropospheric temperatures (our UAH group, and the Remote Sensing Systems [RSS] group) show 2014 lagging significantly behind 2010 and especially 1998:
Viewed another way:
Another instance highlighting the NOAA’s overestimating temperature is when it said October was the hottest month ever, but RSS data showed October to be ninth warmest on record. And I wonder what family members on the East-Coast would say to there being more than 400 record lows and record cool highs set, via The Weather Channel (11/2014):
A third surge of cold air pushed into the Northern Plains, Upper Midwest and East Coast. This third surge reinforced the cold temperatures for millions of Americans who have already endured at least a week of January-like chill.
There have been more than 400 record lows and record cool highs set, covering 43 states, since Sunday. That leaves only five states in the contiguous U.S., all in New England, that have not experienced record cold temperatures this week.
On Wednesday morning record lows were broken or tied from New York to Houston. Thursday morning brought more record cold to parts of the Southeast.
[….]
– First arctic surge: Spread into the East last week (November 11-15).
– Second arctic surge: Blasted through the East, Midwest, and South through early Thursday (November 16-20). For parts of the mid-Mississippi Valley, Ohio Valley, Tennessee Valley and the Middle Atlantic States, this was the coldest of the surges, with numerous daily record lows broken.
– Third arctic surge: Reached the Northern Plains and Upper Midwest Thursday, then slid east across the Great Lakes and parts of the Northeast on Friday. It did not press nearly as far south as the first and second surges did.
– Cold relief: Relief began in the Rockies, then expanded into the southern Plains and Southeast Wednesday and Thursday. Midwest and Northeast relief arrives this weekend.…
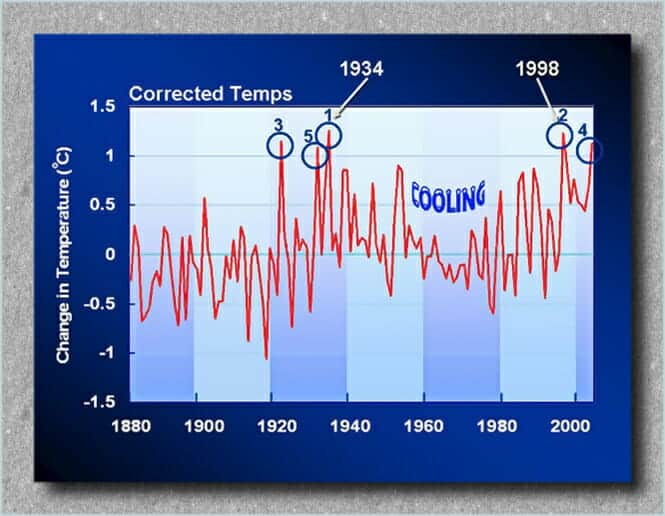
Okay, what we have already seen is that the satellite temperatures say 2014 will NOT BE the hottest year. One should ask what the hottest year was: 1934:
(L.A. Times) A slight adjustment to U.S. temperature records has bumped 1998 as the hottest year in the country’s history and made the Dust Bowl year of 1934 the new record holder, according to NASA.
[….]
That meant that 1998, which had been 0.02 degrees warmer than 1934, was now 0.04 degrees cooler.
This is where I transition to the NOAA temperature, but I wanted to take this transition with help from Dr. Willie Soon (NM), who is an Astrophysicist and Geoscientist at the Solar and Stellar Physics (SSP) Division, Harvard-Smithsonian Center for Astrophysics. (I will embolden the point made below.) More and more scientists have been coming out of the closet and Dr. Soon is one of them. He says in fact that if his community continues “to keep silent and do not express outrage like the one I now feel, the notion of science as a philosophy and way of life will soon be reduced to computer games and animation for the mind-controllers and beauty-contest institutions….” Dr. Soon continues:
2014 hottest year a manipulation
Is this a joke or simply my BAD dream? Prostituting science like this is now consider a virtue. It is no wonder that science writer Lord Ridley said that he has lost his faith on science as an institution.
Why would anyone even bother with claims and insistence of the globe in 2014 being the hottest to a relative colder years all within a few hundredths of a degree Celsius? Poor Anders Celsius should be dancing in his grave.
The claim is based on just one (from a half dozen or so) thermometer-based products whose measurement quality is fraught with uncertainty and with actual error bars at least ten times larger than those claimed “effects”.WMO and others simply pick and choose the “data” that produces the press news they want in time for the Lima, Peru political pow-wow.
In truth the datasets taken as a whole clearly show that the global temperature has been flat-trending for nearly two decades now and that the theory of rising CO2 leading to global warming is sorrowfully exaggerated.
This kind of manipulative science, exemplified by IPCC, WMO, NOAA and what have you, is serving its master in the realm of politics and policy, and is indeed very sickening.
All of them are essentially behaving in ways we would never want any of our school children to behave: cheating and manipulating that are accompanied by careful wording and clever rhetoric….
This sets us up for HOW the NOAA gets their temperatures, and why they are inaccurate. The below is posted elsewhere on my blog and is semi-technical for the layman. But the key is PLACEMENT, and you can see that in the photo’s below Dr. Mueller’s presentation on how the numbers are skewed/manipulated.
(Dr. Mueller is part of the Department of Physics at the University of California at Berkeley, and Faculty Senior Scientist at the Lawrence Berkeley Laboratory, where he is also associated with the Institute for Nuclear and Particle Astrophysics.)
ESPIONAGE
There seems to be a misunderstanding by the general public of the NOAA and other organizations and how they misuse data points (or average them wrongly).
So, for instance, professor Mueller at Berkeley mentions how climate “scientists” were hiding the decline in the past:
They were skewing the numbers in other words. This is an example of fraud. But numbers can be skewed by faulty or outdated methods/equipment. For instance,
EQUIPMENT FAIL
Here is a recent mention of the below in COMMENTARY MAGAZINE (added here 9-4-19):
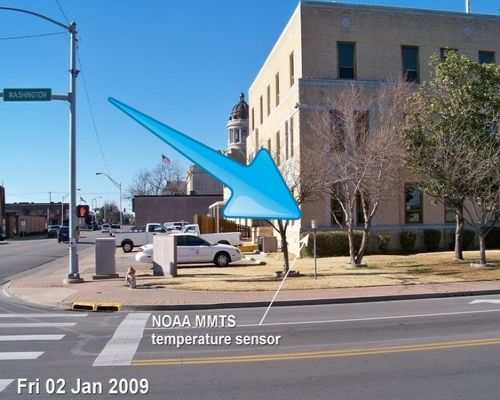
…A STUDYby meteorologist Anthony Watts found that almost 90 percent of the 1221 weather stations in the U.S. did not meet the National Weather Service’s setting standards, which requires that they be at least 100 feet from any artificial heat source or radiating surface. You can see some of the most egregious violators here. To deal with this defective information, climate scientists, have “adjusted” the data to solve this problem. Invariably, these adjustments have made earlier data show lower temperatures, and recent data show higher ones.
To develop reliable data, the National Oceanic and Atmospheric Administration (NOAA) placed 114 state-of-the-art weather stations relatively evenly spaced about the lower 48 states. They were carefully sited to be away from urban areas, which are heat islands, airports, which can be affected by jet exhaust, etc.
The system became operative in 2005. Now, realclearenergy.com is reporting that there has been no increase in average temperatures in the continental United States over the last 14 years, as measured by these new stations. If anything, overall temperatures are slightly cooler than they were….
Here are some examples of fudged data because of sub-standard equipment:
You’d think the answer would be obvious, but here we have a NOAA operated USHCN climate station of record providing a live experiment. It always helps to illustrate with photos. Today I surveyed a sewage treatment plant, one of 4 stations surveyed today (though I tried for 5) and found that for convenience, they had made a nice concrete walkway to allow servicing the Fisher-Porter rain gauge, which needs a paper punch tape replaced one a month.
Here is what you see in visible light:
Here is what the infrared camera sees:
Note that the concrete surface is around 22-24°C, while the grassy areas are between 12-19°C
Class 5 (error >~= 5C) – Temperature sensor located next to/above an artificial heating source, such a building, roof top, parking lot, or concrete surface.”
More than half of the stations the NOAA use are tainted or wrongly placed equipment.
CHANGING DATA-SETS
Another example of changing averages was noted by Steve Goddard and others — even the NOAA have acknowledge it — have been discussing recently is exemplified in Dr. Judith Carry’s post on the matter (from a larger post of mine):
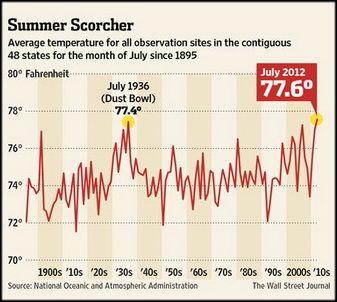
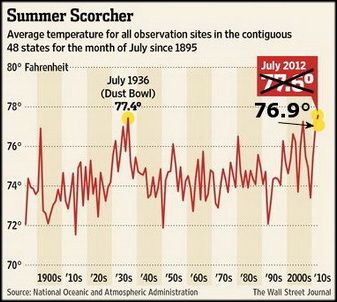
Even the Wall Street Journal chose the higher temperature reading to say that July of 2012 was July was the “hottest month in the contiguous U.S. since records began in 1895.” WUWT found this on accident and it has led to quite a few other revelations as we will see. Here is description in part of what we looking at:
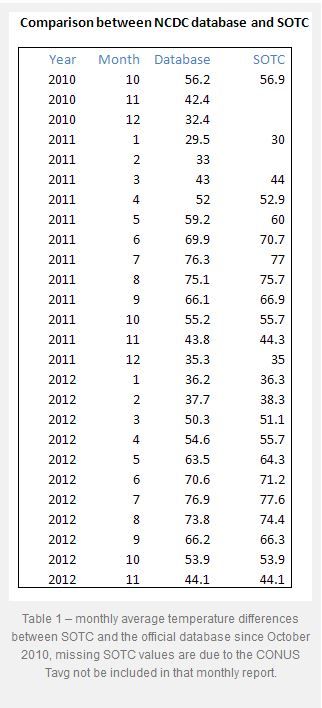
Glaring inconsistencies found between State of the Climate (SOTC) reports sent to the press and public and the “official” climate database record for the United States. Using NCDC’s own data, July 2012 can no longer be claimed to be the “hottest month on record”.
[….]
I initially thought this was just some simple arithmetic error or reporting error, a one-off event, but then I began to find it in other months when I compared the output from the NCDC climate database plotter. Here is a table of the differences I found for the last two years between claims made in the SOTC report and the NCDC database output.
[….]
In almost every instance dating back to the inception of the CONUS Tavg value being reported in the SOTC report, there’s a difference. Some are quite significant. In most cases, the database value is cooler than the claim made in the SOTC report. Clearly, it is a systemic issue that spans over two years of reporting to the press and to the public.
It suggests that claims made by NCDC when they send out these SOTC reports aren’t credible because there are such differences between the data. Clearly, NCDC means for the plotter output they link to, to be an official representation to the public, so there cannot be a claim of me using some “not fit for purpose” method to get that data….
The WALL STREET JOURNAL made a graph showing this record setting month (below-left). The more accurate temperature for July likewise is shown in the same graph (below-right):
This looking at the data sets chosen and what is used and isn’t used to support an idea that fails in every way. Combine this obvious cherry-picking with the bias, collusion, and charges against the report that the President used to route Congress, all show we have a problem Houston! But this is only the tip of the proverbial iceberg. It seems the NOAA has been skewing these temps for some time. Why? Because the left uses this as a way to promote an ever growing government and the scientists get more-and-more funding. This data fudging story is newer, and it is evolving quickley, including this newest post via Real Science where Steve Goddard notes that More Than 40% Of USHCN Station Data Is Fabricated. Here is Dr. Judith carry’s synopsis (excerpted), in which she critiques a bit Goddard’s post… but then bows to the evidence:
OK, acknowledging that Goddard made some analysis errors, I am still left with some uneasiness about the actual data, and why it keeps changing. For example, Jennifer Marohasy has been writing about Corrupting Australian’s temperature record.
In the midst of preparing this blog post, I received an email from Anthony Watts, suggesting that I hold off on my post since there is some breaking news. Watts pointed me to a post by Paul Homewood entitled Massive Temperature Adjustments At Luling, Texas. Excerpt:
So, I thought it might be worth looking in more detail at a few stations, to see what is going on. In Steve’s post, mentioned above, he links to the USHCN Final dataset for monthly temperatures, making the point that approx 40% of these monthly readings are “estimated”, as there is no raw data.
From this dataset, I picked the one at the top of the list, (which appears to be totally random), Station number 415429, which is Luling, Texas.
Taking last year as an example, we can see that ten of the twelve months are tagged as “E”, i.e estimated. It is understandable that a station might be a month, or even two, late in reporting, but it is not conceivable that readings from last year are late. (The other two months, Jan/Feb are marked “a”, indicating missing days).
But, the mystery thickens. Each state produces a monthly and annual State Climatological Report, which among other things includes a list of monthly mean temperatures by station. If we look at the 2013 annual report for Texas, we can see these monthly temperatures for Luling.
Where an “M” appears after the temperature, this indicates some days are missing, i.e Jan, Feb, Oct and Nov. (Detailed daily data shows just one missing day’s minimum temperature for each of these months).
Yet, according to the USHCN dataset, all ten months from March to December are “Estimated”. Why, when there is full data available?
But it gets worse. The table below compares the actual station data with what USHCN describe as “the bias-adjusted temperature”. The results are shocking.
In other words, the adjustments have added an astonishing 1.35C to the annual temperature for 2013. Note also that I have included the same figures for 1934, which show that the adjustment has reduced temperatures that year by 0.91C. So, the net effect of the adjustments between 1934 and 2013 has been to add 2.26C of warming.
Note as well, that the largest adjustments are for the estimated months of March – December. This is something that Steve Goddard has been emphasising.
It is plain that these adjustments made are not justifiable in any way. It is also clear that the number of “Estimated” measurements made are not justified either, as the real data is there, present and correct.
Watts appears in the comments, stating that he has contacted John Nielsen-Gammon (Texas State Climatologist) about this issue. Nick Stokes also appears in the comments, and one commenter finds a similar problem for another Texas station.
Homewood’s post sheds light on Goddard’s original claim regarding the data drop out (not just stations that are no longer reporting, but reporting stations that are ‘estimated’). I infer from this that there seems to be a real problem with the USHCN data set, or at least with some of the stations. Maybe it is a tempest in a teacup, but it looks like something that requires NOAA’s attention. As far as I can tell, NOAA has not responded to Goddard’s allegations. Now, with Homewood’s explanation/clarification, NOAA really needs to respond….
So we see in the above, that temperatures can be changed years later as the totality of the data is included. What was considered the hottest falls to just an average month in the heat index.
And this has — within the past few months — turned into a very large debate.
EQUIPMENT FAIL II
Here is another example of older/faulty equipment:
A Quick Note about the Difference between RSS and UAH TLT data
There is a noticeable difference between the RSS and UAH lower troposphere temperature anomaly data. Dr. Roy Spencer discussed this in his July 2011 blog post On the Divergence Between the UAH and RSS Global Temperature Records. In summary, John Christy and Roy Spencer believe the divergence is caused by the use of data from different satellites. UAH has used the NASA Aqua AMSU satellite in recent years, while as Dr. Spencer writes:
…RSS is still using the old NOAA-15 satellite which has a decaying orbit, to which they are then applying a diurnal cycle drift correction based upon a climate model, which does not quite match reality.
While the two lower troposphere temperature datasets are different in recent years, UAH believes their data are correct, and, likewise, RSS believes their TLT data are correct. Does the UAH data have a warming bias in recent years or does the RSS data have cooling bias? Until the two suppliers can account for and agree on the differences, both are available for presentation.
ROSE COLORED GLASSES
Another example of competing ideas is this example from two major UK papers, the first being from the Guardian:
This next one from the Daily Mail:
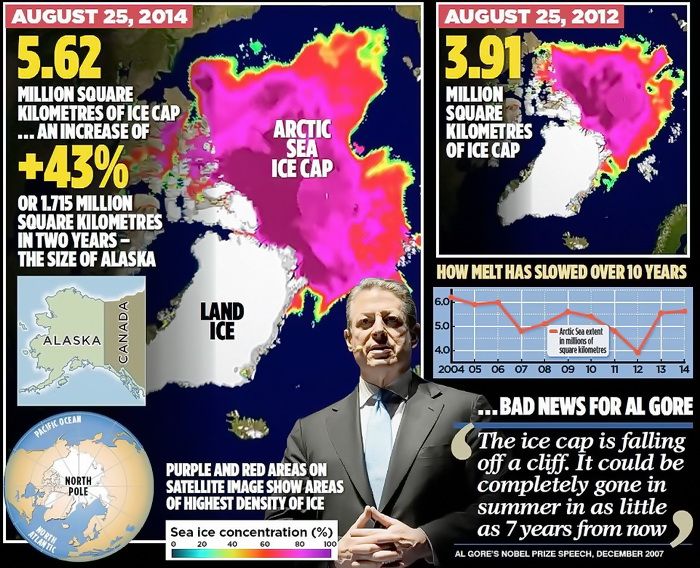
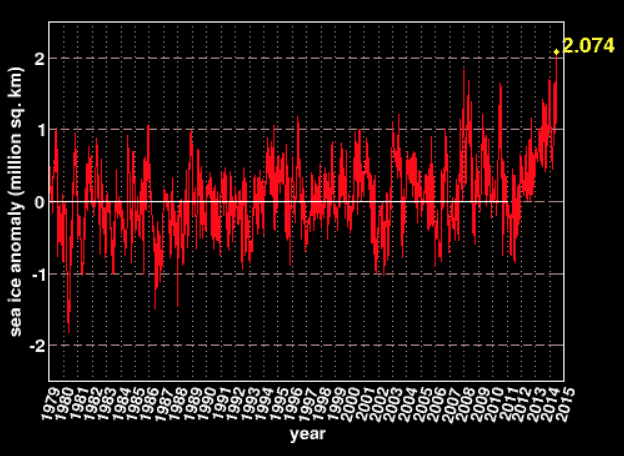
(DAILY MAIL) ….The most widely used measurements of Arctic ice extent are the daily satellite readings issued by the US National Snow and Ice Data Center, which is co-funded by Nasa. These reveal that – while the long-term trend still shows a decline – last Monday, August 25, the area of the Arctic Ocean with at least 15 per cent ice cover was 5.62 million square kilometres.
This was the highest level recorded on that date since 2006 (see graph, right), and represents an increase of 1.71 million square kilometres over the past two years – an impressive 43 per cent.
Other figures from the Danish Meteorological Institute suggest that the growth has been even more dramatic. Using a different measure, the area with at least 30 per cent ice cover, these reveal a 63 per cent rise – from 2.7 million to 4.4 million square kilometres.
[….]
Crucially, the ice is also thicker, and therefore more resilient to future melting. Professor Andrew Shepherd, of Leeds University, an expert in climate satellite monitoring, said yesterday: ‘It is clear from the measurements we have collected that the Arctic sea ice has experienced a significant recovery in thickness over the past year.
‘It seems that an unusually cool summer in 2013 allowed more ice to survive through to last winter. This means that the Arctic sea ice pack is thicker and stronger than usual, and this should be taken into account when making predictions of its future extent.’
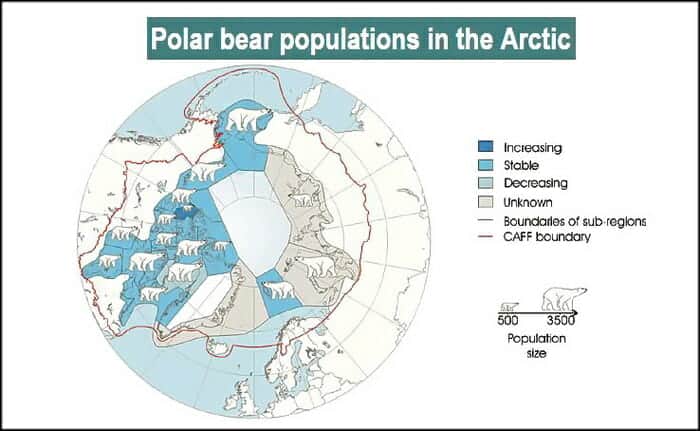
Same data used, one says BEWARE, the END IS NEAR, the other says making gains, as the graph shows below:
(So are Polar Bears, BTW) And the Antarctic has made BIG GAINS. But if the left — yes, the left — says we should renter the little ice-age to be at a normal point of “climate disruption,” then they are living a pipe-dream. As the earth gets warmer life flourishes, as warmer periods in history have exemplified:
June was ranked one of the coldest months in a while. According to the NOAA, July 2014 ranked 29th coldest out of 120using the Maximum temperature. And so we enter the discussion about if the pause is real… which is now being acknowledged by almost all (except the IPCC).
PAUSE
Here is Dr. Judith Curry posting ion the subject before getting into two papers that talk about it from two points of view:
With 39 explanations and counting, and some climate scientists now arguing that it might last yet another decade, the IPCC has sidelined itself in irrelevance until it has something serious to say about the pause and has reflected on whether its alarmism is justified, given its reliance on computer models that predicted temperature rises that have not occurred. – Rupert Darwall
The statement by Rupert Darwall concisely states what is at stake with regards to the ‘pause.’ This seriously needs to be sorted out….
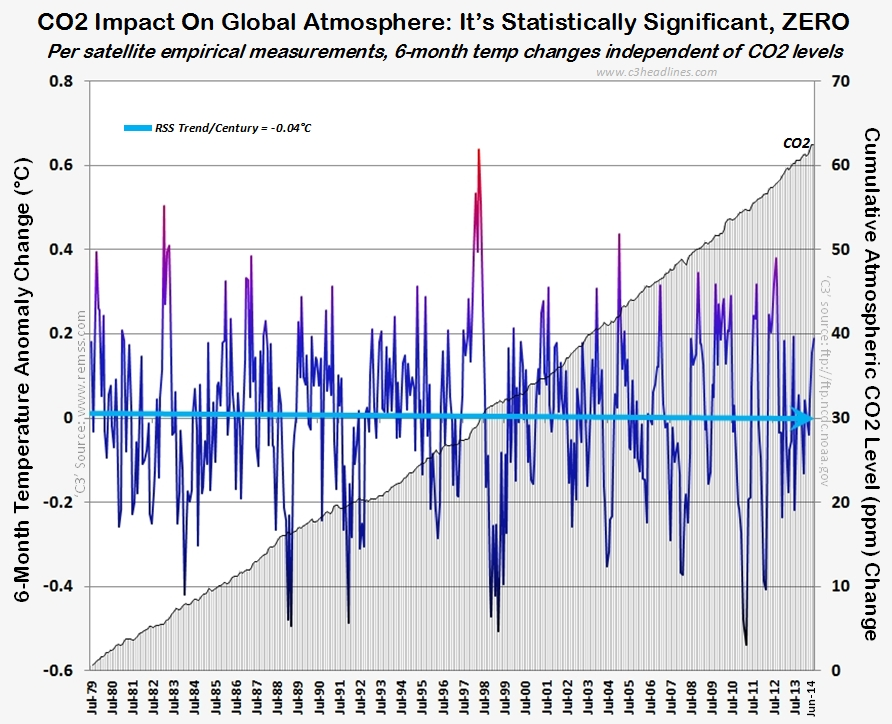
For a running — updated — list of these excuses mentioned above, see here.What HAS been clearly shown is that while some wish to make CO2 illegal, CO2 is in fact not driving the climate:
GROUP-THINK
What is being shown as of late is that more-and-more scientists are becoming concerned with the group-think in the climate-sciences. Again, Dr. Judith Curry was the biggest pro-AGW proponent, but has — like many others leaders in their respective field — changed or softened her/their positions on what the science is actually showing:
The implications of dogmatic groupthink and intimidation for the pursuit of sound science — and sound policy — are chilling. – Christopher Snowden
A collection of articles from the health science community on the fate of papers and scientists that challenge the consensus.
SUN & OCEAN
Gross Scientific Negligence – IPCC Ignored Huge Body Of Peer-Reviewed Literature Showing Sun’s Clear Impact – See more at: http://tinyurl.com/kw47zcf (NASA is changing on this as well)
NASA is saying the sun — thanks to the Goddard Institute studying this, is the driver of warming and cooling: http://tinyurl.com/m29yo99 (Via Hockey Shtick)
And yet another study is showing the sun as the major player… NOT greenhouse gases.
So what’s the bottom line? NOAA temps change over time. Many in this respective field are seeing group-think. Ideology is driving this group-think, not science.
Why should you be interested? Sea surface temperature records indicate El Niño and La Niña events are responsible for the warming of global sea surface temperature anomalies over the past 30 years, not man-made greenhouse gases. I’ve searched sea surface temperature records for more than 4 years and ocean heat content records for more than 3 years, and I can find no evidence of an anthropogenic greenhouse gas signal in either dataset. That is, the warming of the global oceans has been caused by naturally occurring, sunlight-fueled, coupled ocean-atmosphere processes, not anthropogenic greenhouse gases.
No matter what evidences one puts forward, until people remove their rose-colored glasses, they will continue to explain away the pause showing CO2 has nothing to do with global temperatures.
From a FaceBook discussion… I incorporate Al Gore’s thinking:
Look, it is simple:
Either polar bears are dying because of CO2 emissions via man ~ hence, we should stop producing high levels of CO2;
or [following the train of thinking FROM Al Gore],
Polar bears are at their highest recorded population levels because of CO2 emissions via man, hence, we should produce high levels of CO2.
If “a,” why not “b”?
This is meant mainly as a supplement to a Christmas Eve-Eve gathering/discussion I was at. I will make this post a little different than other posts, as, it will be “minimalist.” This is the fourth installment of the topics covered, which are polar bears, rising sea levels, CO2, Inconvenient Truth (the movie), nuclear power, warmest year, electric vehicles (EVs)/hybrid cars, and bullet trains.
Read more. Here are some designations I will use in stories linked to:
...More Than opinion
Either the polar Bear population is at record levels/health, or they are not.
Either one is true and the other false. Both cannot be true. So where do we align our opinion with that reflects the evidence closest?
In other words… we are asking a question or drawing a distinction that is beyond opinion:
“…there are about 25,000 polar bears across Canada’s Arctic. ‘That’s likely the highest [population level] there has ever been’.”
(more below)
Main-stream (MS) news sources such as the New York Times or CNN;
As well as non-main-stream sources or “new media” (NMS), which include blogs by either specialists or new media news sources. These typically reference and link to main-stream news sources or “neutral” media [see below];
I will also try to include more “neutral” media (NM), such as the World Wildlife Fund or NASA.
I do this in the hopes that those reading this from the conversation will have a better recourse — outside of myself — to complete a picture I was trying to (not too well considering the new wines and beer making their rounds for our tasting pleasure). I will first, however, deal with Polar Bears.
If someone were to happen across this post I would at least like them to think long and well on this one issue. And it is this: we may hold an opinion, yes… but we cannot “own” our own facts.
So… for instance. From the conversation polar bears were brought up as an evidence for man-caused global warming impacts. The “Inconvenient Truth” was mentioned as a source for this dilemma… and… I must say… this is a great commentary on the power of media. As we will see. I own and have watched the Inconvenient Truth. But I own and also have watched the Great Global Warming Swindle. This isn’t to “toot” my own horn but is how I challenge my children to think critically. Look at both sides and make a fully informed decision.
Which is much needed in our political and social discourse. For instance, Ronald Reagan and Tipp O’Neil were ideological foes, coming to conclusions on most things as opposites can allow. HOWEVER, Reagan and Tipp would regularly meet to talk, smoke cigars, and debate vigorously their ideas and would try and compromise. [Obama has met once with John Boehner, FYI]
In our current dialogue one side often finds solace in demonizing the other as anti-science, or sexist, intolerant, xenophobic, homophobic, Islamophobic, racist, bigoted.
Who would have a serious discussion with someone who is a believer in a flat-earth (anti-science)?
Who would want to talk about anything with someone who is a racist?
Which brings to a 21-second blurb by a very left-leaning professor saying that this type of thinking is damaging to the young liberal student:
To wit….
Either the polar Bear population is at record levels/health, or they are not.
Either one is true and the other false. Both cannot be true. So where do we align our opinion with that reflects the evidence closest? In other words… we are asking a question or drawing a distinction that is beyond opinion.
POLAR BEARS
...The Narrative Falls Apart
ABC television in Australia, on a show called “Media Watch,” recently debunked the entire issue
Sources Of Myth
(MS) JUNEAU, Alaska (AP 7/2011) — Just five years ago, Charles Monnett was one of the scientists whose observation that several polar bears had drowned in the Arctic Ocean helped galvanize the global warming movement….
(MS) JUNEAU, Alaska (The Guardian via the AP, 12/2013) An Alaska scientist whose observations of drowned polar bears helped galvanize the global warming movement has retired as part of a settlement with a federal agency.
[….]
…In 2004, during an aerial survey of bowhead whales, Monnett and another researcher saw four dead polar bears floating in the water after a storm, observations that were later detailed in a peer-reviewed article. They said they were reporting to the best of their knowledge the first observations of the bears floating dead and presumed drowned while apparently swimming long distances.
They said their findings suggested drowning-related deaths of polar bears may increase in the future if the regression of pack ice or periods of longer open water continues. The observations helped make the polar bear a symbol for the climate change movement.
(NMS) American Thinker (5/2014, via Polar Bear Science) The greatest scientific fraud in history is slowly but surely unraveling, and the breadth of the corruption revealed is stunning. As any good con man knows, and emotional appeal is necessary, and the warmists found their cuddly-looking icon of endangerment in the polar bear, an animal frequently chosen as stuffed toys for children to hug. Pictures of polar bears on ice floes, presumably doomed to death by drowning as the Arctic ice disappeared, were used to tug on the heartstrings of adults and children alike, in order to scare them into willingly handing over power over their economic destiny to global mandarins who would reduce their standard of living.
But it was necessary to come up with “scientific” estimates of polar bear populations that showed them in danger. With all the billions of dollars available for global warming-related research, and the level of peer pressure that money generates, it wasn’t that difficult….
“It was convenient with the new environmental paradigm and attribution of all change to humans to claim global warming causing melting [sea] ice was killing the polar bears. It was wrong and policy based on it is unnecessary and unjustified. The Inuit are victims of what Paul Driessen wrote about in his book EcoImperialism, the forceful imposition of western environmental values on other cultures, usually to their detriment.
“Nobel Physicist Richard Feynman said, “Reality must take precedence over public relations, for nature cannot be fooled.”
“Polar bears have successfully adapted to nature for eons before civilization began. That must be the basis for policy, not data severely limited and distorted by emotional, anthropomorphic, political agendas presented under the guise of the precautionary principle.”
The PBSG first provided a global population range estimate for polar bears in 1993. The range specified at that time, 21,470-28,370 polar bears, included statistically solid estimates (e.g. based on studies to estimate population abundance) for many of the identified polar bear subpopulations, and estimates (based knowledge of habitat quality and input from scientists) for several other subpopulations. Recognizing the false precision implied by a range of 21,470-28,370, the estimate was rounded to 22,000-27,000 in 1997. After some new population estimates were developed and after more discussion of the possible numbers in areas without estimates, the range was adjusted to 21,500-25,000 in 2001, and further simplified to 20,000-25,000 in 2005. The variation in ranges reflects the absence of rigorous estimates of subpopulation size in several areas and the consensus desire to express a reasonable round number range that could not be interpreted as more reliable than it really is.
Over the years following the first global population range estimate, the PBSG has refined subpopulation size estimates in some areas, but there still are areas where we have only educated hypotheses regarding numbers of animals present. Currently, the PBSG recognizes 19 subpopulations in the circumpolar Arctic. Scientific estimates are available for 14 (Baffin Bay, Barents Sea, Davis Strait, Foxe Basin, Gulf of Boothia, Kane Basin, Lancaster Sound, M’Clintock Channel, Northern Beaufort Sea, Norwegian Bay, Southern Beaufort Sea, Southern Hudson Bay, Viscount Melville Sound, and Western Hudson Bay). Abundance in these 14 populations was estimated using accepted inventory methods (e.g., mark and recapture or aerial survey). These estimates, descriptions of how they were developed, and the history of how they have been improved over the years, can be viewed in the population status tables (to be viewed in the proceedings). Until 2005, the PBSG status table also included estimates for 3 subpopulations (Chukchi Sea, Kara Sea, and Laptev Sea) where accepted methods never had been applied. These estimates were removed because including them in the table suggested they were more reliable than they really were. The PBSG has never provided estimates for two other regions (Arctic Basin and East Greenland). Bear numbers in the Arctic Basin are very low and bears present there may simply be passing through rather than representing a true subpopulation. East Greenland appears to have a resident group of polar bears but the PBSG has never ventured an estimate of their abundance.
For the 14 subpopulations with scientific estimates, the sum of the mid-point estimates is 18,349 bears (see http://pbsg.npolar.no/en/status/status-table.html for estimates). The PBSG expects that the number of bears ranges from several hundreds to a few thousands in each of the subpopulations in Chukchi, Kara, Laptev and East Greenland, bringing the midpoint estimate to approximately 25,000.
Because the global population estimate range includes subpopulation estimates of variable quality it is not used as a monitoring benchmark or other status assessment tool. Rather, it simply expresses a reasonable range in numbers, based on a combination of the best available information and understandings of polar bear habitat. Conservation assessments focus on the trends in subpopulations for which statistical estimates are available. Some of those subpopulations are declining, others are stable, and some may be increasing.
(MS) WINNIPEG, Canada (Globe and Mail 4/2012) The number of bears along the western shore of Hudson Bay, believed to be among the most threatened bear subpopulations, stands at 1,013 and could be even higher, according to the results of an aerial survey released Wednesday by the Government of Nunavut. That’s 66 per cent higher than estimates by other researchers who forecasted the numbers would fall to as low as 610 because of warming temperatures that melt ice faster and ruin bears’ ability to hunt. The Hudson Bay region, which straddles Nunavut and Manitoba, is critical because it’s considered a bellwether for how polar bears are doing elsewhere in the Arctic.
[….]
But many Inuit communities said the researchers were wrong. They said the bear population was increasing and they cited reports from hunters who kept seeing more bears. Mr. Gissing said that encouraged the government to conduct the recent study, which involved 8,000 kilometres of aerial surveying last August along the coast and offshore islands.
Mr. Gissing said he hopes the results lead to more research and a better understanding of polar bears. He said the media in southern Canada has led people to believe polar bears are endangered. “They are not.” He added that there are about 25,000 polar bears across Canada’s Arctic. “That’s likely the highest [population level]there has ever been.”
[Editors note: perhaps to 27,000-32,000?]
(NM) United Nations Environmental Programme (UNEP, 2001):
(NMS) Gateway Pundit (7/2011) of the same, but updated info of populations:
(NM) “The total number of polar bears worldwide is estimated to be 20,000-25,000.” [pg. 33]
[….]
“The world’s polar bears are distributed in 19 subpopulations over vast and sometimes relatively inaccessible areas of the Arctic. Thus, while the status of some subpopulations in Canada and the Barents Sea is well documented, that of several others remains less known [sic]. Thus, it is not possible to give an accurate estimate of the total number of polar bears in the world, although the range is thought to be 20-25,000.” [pg. 61, press release]
Aars, J., Lunn, N. J. and Derocher, A.E. (eds.) 2006. Polar Bears: Proceedings of the 14th Working Meeting of the IUCN/SSC Polar Bear Specialist Group, 20-24 June 2005, Seattle, Washington, USA. Occasional Paper of the IUCN Species Survival Commission 32. IUCN, Gland (Switzerland) and Cambridge (UK). http://pbsg.npolar.no/en/meetings/
(NM) “The total number of polar bears worldwide is estimated to be 20,000-25,000.” [pg. 31]
[….]
“The total number of polar bears is still thought to be between 20,000 and 25,000. However, the mixed quality of information on the different subpopulations means there is much room for error in establishing that range. That potential for error is cause for concern, given the ongoing and projected changes in habitat and other potential stressors.” [pg. 86, press release]
Obbard, M.E., Theimann, G.W., Peacock, E. and DeBryn, T.D. (eds.) 2010. Polar Bears: Proceedings of the 15th meeting of the Polar Bear Specialists Group IUCN/SSC, 29 June-3 July, 2009, Copenhagen, Denmark. Gland, Switzerland and Cambridge UK, IUCN. http://pbsg.npolar.no/en/meetings/
Recent Population Increase Partly Due To Lots of Sea-Ice
(MS) Canada (CBC News via the Canadian Coast Guard, 3/2014) [ARCTIC Sea Ice] The Canadian Coast Guard is pleading with merchant ships to plan their voyages well in advance this year as the organization’s icebreaker fleet confronts some of the worst ice conditions on the Atlantic Ocean in decades.
“Plan your voyage and we’ll all get through this,” said Mike Voight, the Atlantic region’s director of programs. “We’ve got a pretty bad or challenging ice year.”
The Canadian Ice Service, an arm of Environment Canada, said there is 10 per cent more ice this year compared to the 30-year average.
“We probably haven’t seen a winter this bad as far as ice for the past 25 years,” said Voight, referring to both the amount and thickness of the ice….
(NM) The American Geophysical Union (AGU) Abstract (12/2014) [ARCTIC sea ice] Despite a well-documented ~40% decline in summer Arctic sea ice extent since the late 1970’s, it has been difficult to estimate trends in sea ice volume because thickness observations have been spatially incomplete and temporally sporadic. While numerical models suggest that the decline in extent has been accompanied by a reduction in volume, there is considerable disagreement over the rate at which this has occurred. We present the first complete assessment of trends in northern hemisphere sea ice thickness and volume using 4 years of measurements from CryoSat-2. Between autumn 2010 and spring 2013, there was a 14% and 5% reduction in autumn and spring Arctic sea ice volume, respectively, in keeping with the long-term decline in extent. However, since then there has been a marked 41% and 9% recovery in autumn and spring sea ice volume, respectively, more than offsetting losses of the previous three years. The recovery was driven by the retention of thick ice around north Greenland and Canada during summer 2013 which, in turn, was associated with a 6% drop in the number of days on which melting occurred – climatic conditions more typical of the early 1990’s. Such a sharp increase in volume after just one cool summer indicates that the Arctic sea ice pack may be more resilient than has been previously considered.
(NMS) Talking About Weather (7/2014) [ANTARCTIC sea ice] Antarctic sea ice has hit its second all-time record maximum this week. The new record is 2.112 million square kilometers above normal. Until the weekend just past, the previous record had been 1.840 million square kilometers above normal, a mark hit on December 20, 2007, as I reported here, and also covered in my book.
Mark Serreze, director of the National Snow and Ice Data Center, responded to e-mail questions and also spoke by telephone about the new record sea ice growth in the Southern Hemisphere, indicating that, somewhat counter-intuitively, the sea ice growth was specifically due to global warming.
Shoebat (<< lots of good material to read at link) notes the verse pictured above as reading thus:
Against them make ready your strength to the utmost of your power, including steeds of war, to strike terror into (the hearts of) the enemies, of Allah and your enemies, and others besides, whom ye may not know, but whom Allah doth know. Whatever ye shall spend in the cause of Allah, shall be repaid unto you, and ye shall not be treated unjustly.
Ismaaiyl Abdullah Binsley is a suspect in the killing of his girlfriend on Saturday;
Ismaaiyl Abdullah Binsley is said to be a member of a Black Guerilla Family (BGF) gang with connections to the Black Panthers;
Ismaaiyl Abdullah Binsley is confirmed being a Muslim (He put a pic of the Qu’ran on his FB).
(An editors note, in the lower right corner of the above picture FaceBook suggested Ismaaiyl Abdullah Binsley “like” Bill Warner’s page. If Ismaaiyl too Dr. Warner’s words to heart he wouldn’t have been in a death cult.)
The sad news today from New York is that two families and all the friends and NYPD co-workers lost two of their own. “They were quite simply assassinated, targeted for their uniforms, and for the responsibility they embraced to keep the people of this city safe,” Police Commissioner Bill Bratton said at a news conference on the deaths of Officers Wenjian Liu and Rafael Ramos. On a left-leaning cartoonists tribute to a police officer back in September, I said this:
The “victim-hood” mentality imposed on people in the liberal trinity (race, class, gender) will be coming home to roost. From the left saying that Chris Matthews has a “white privileged” aspect to him as a person will grow until even the monster the left has created will turn on them.
I only see support from the legacy media in times like these, when they are dead or severely wounded, not when they have an almost 300-pound, 6’4″ [stoned] giant pounding a cops face. Rather the media has it in em’ to create an almost mob-like mentality then cry foul when they also get bitch slapped and have camera stolen.
That’s sad.
The NYPD turned their backs (rightly so) on the Mayor as he walked into the Woodhull Hospital:
The Mayor and Race Hustlers To Blame
A blue wall of silently seething police officers turned their backs on Mayor de BlasioSaturday night — literally.
As the mayor and his entourage snaked through a jammed third-floor corridor at Woodhull Hospital, where two officers had been pronounced dead just hours earlier, scores of grieving cops faced the walls — and away from the leader they believe has failed them.
Earlier, de Blasio approached a cluster of cops at the Brooklyn Hospital and offered, “We’re all in this together.”
“No we’re not,” an officer replied tersely, according to a cop who witnessed the icy scene.
The rank-and-file’s anger at the mayor was palpable citywide.
“It’s f–king open season on us right now,” one officer said. “When is he going to step up?”
Just last week, cops began signing a “Don’t Insult My Sacrifice” waiver, distributed by the PBA, that warned the mayor and speaker to stay away from funerals of cops killed in the line of duty.
It is not known if the officers slain Saturday had signed the waiver. which singles out de Blasio and Council Speaker Melissa Mark-Viverito for their “consistent refusal to show police officers the support and respect they deserve.”
Many cops said they blame deBlasio for helping to create a climate of distrust in cops that has turned them into targets.
They pointed to Hizzoner just last week calling an assault by Brooklyn Bridgeprotesters on two NYPD lieutenants an “alleged” assault, even as dramatic video of the attack emerged.
De Blasio revealed in an ABC News interview earlier this month that he and First Lady Chirlane McCray had instructed their biracial son, Dante, about the “dangers” that police pose….
On the 12th of December Mew York police officers made it clear that Mayor de Blasio is NOT welcome at their funerals. Unfortunately that was a bit prophetic. The FBI sent out a warning about a black supremacist prison gang, Black Gurilla Family (BGF) that has taken it upon themselves to kill police officers. Ismaaiyl Abdulah Brinsley, 28, “shot two cops dead as they sat in a patrol car in Bedford-Stuyvesant to avenge the deaths of Michael Brown and Eric Garner. He also shot his former girlfriend at her home in the Baltimore area on Saturday morning, police said. Law enforcement sources said the NYPD has dispatched investigators to Baltimore to probe Brinsley’s past and suspected involvement with the Black Guerrilla Family prison gang.”
Here is more:
The Federal Bureau of Investigations field office in Baltimore, Maryland issued a warning Friday that the Black Guerilla Family prison was plotting to attack white police officers in the state.
The Baltimore Sun included the report of the threat in an article on the Maryland ties to the execution of two police officers, Rafael Ramos and Wenjian Liu, in New York City Saturday afternoon by Ismaaiyl Abdulah Brinsley.
Brinsley reportedly shot his girlfriend early Saturday morning in the Baltimore suburb of Owings Mills before he headed to New York. Neither of the slain New York officers was white.
Apparently the Sun has the exclusive on the threat, but buried it in the middle of the lengthy article. The Baltimore FBI has not released the information to the public.
“On Friday, the Baltimore FBI office issued a memo that the Black Guerrilla Family gang was targeting “white cops” in Maryland, an agency spokeswoman confirmed. The memo, circulating among officers, said a contact who had given reliable information in the past said members of the gang — connected to the high-profile corruption scandal at the Baltimore City Detention Center — were planning to target white officers to “send a message.”
“A federal law enforcement official said Brinsley had no known ties to the BGF.”
Earlier this month the New York Daily News reported the BGF was plotting to attack New York City police officers. The threat was soon allegedly deemed not credible by the NYPD….
…Making its rounds on many counter-Jihad blogs. It was released 4 days ago. An absolute must see. The nose-in-the-air Dutchman (obviously not of Geert Wilder’s party), makes a stunningly condescending statement.
[….]
Glick lets him say his peace, then rips into him.
Note – Glick is a longtime friend and colleague of Ayn Randian individualist Pamela Geller, and defended Sarah Palin from vicious attacks by the left in the 2008 presidential campaign.
Thanks to PowerLine for the h/t for this interview, to which they mention ~ the three segments are rolled up into one at PowerLine:
…Kelly is without doubt the best interviewer on television. I don’t think there is a close second. She needed to bring all her skills to bear in the course of the interview last night (and I think she did so live).
Mitchell did not make for an an easy interview. He was guarded and angry. Kelly worked hard to get Mitchell to open up and bring the subject to life. Watching the interview, I thought Kelly would need to waterboard Mitchell himself to get him to open up. Nevertheless, the interview comes alive at about 18:00 and really takes off in the third segment (beginning at 22:48).
Quotable quotes: “I do not mind giving my life for my country, but I do mind giving my life for a food fight for political reasons between two groups of people who should be able to work it out like adults.”
“Khalid Sheikh Mohammed has the opportunity to address the charges against him, but I don’t.”
“[The Senate Intelligence Committee Democrats’ report] shows al Qaeda and the al Qaeda 2.0 folks, ISIL, that we’re divided and that we’re easy targets, that we don’t have the will to defeat them because that’s what they know. In fact, Khalid Sheikh Mohammed told me personally, ‘Your country will turn on you, the liberal media will turn on you, the people will grow tired of this, they will turn on you, and when they do, you are going to be abandoned.”
…Even many scholars sympathetic to the results of Roe have issued harsh criticisms of its legal reasoning. In the Yale Law Journal, eminent legal scholar John Hart Ely, a supporter of legal abortion, complained that Roe is “bad constitutional law, or rather … it is not constitutional law and gives almost no sense of an obligation to try to be.” He wrote:
What is unusual about Roe is that the liberty involved is accorded … a protection more stringent, I think it is fair to say, than that the present Court accords the freedom of the press explicitly guaranteed by the First Amendment. What is frightening about Roe is that this super-protected right is not inferrable from the language of the Constitution, the framers’ thinking respecting the specific problem in issue, any general value derivable from the provisions they included, or the nation’s governmental structure. Nor is it explainable in terms of the unusual political impotence of the group judicially protected vis-a-vis the interests that legislatively prevailed over it. And that, I believe … is a charge that can responsibly be leveled at no other decision of the past twenty years. At times the inferences the Court has drawn from the values the Constitution marks for special protection have been controversial, even shaky, but never before has its sense of an obligation to draw one been so obviously lacking.
Below are criticisms of Roe from other supporters of legal abortion.
“One of the most curious things about Roe is that, behind its own verbal smokescreen, the substantive judgment on which it rests is nowhere to be found.” — Laurence H. Tribe, Harvard law professor
“As a matter of constitutional interpretation and judicial method, Roeborders on the indefensible. I say this as someone utterly committed to the right to choose. … Justice Blackmun’s opinion provides essentially no reasoning in support of its holding. And in the … years since Roe‘s announcement, no one has produced a convincing defense of Roe on its own terms.” — Edward Lazarus, former clerk to Justice Harry Blackmun
“The failure to confront the issue in principled terms leaves the opinion to read like a set of hospital rules and regulations. … Neither historian, nor layman, nor lawyer will be persuaded that all the prescriptions of Justice Blackmun are part of the Constitution.” — Archibald Cox, Harvard law professor, former U.S. Solicitor General
“[I]t is time to admit in public that, as an example of the practice of constitutional opinion writing, Roe is a serious disappointment. You will be hard-pressed to find a constitutional law professor, even among those who support the idea of constitutional protection for the right to choose, who will embrace the opinion itself rather than the result. This is not surprising. As a constitutional argument, Roe is barely coherent. The court pulled its fundamental right to choose more or less from the constitutional ether.” — Kermit Roosevelt, University of Pennsylvania law professor
“Roe, I believe, would have been more acceptable as a judicial decision if it had not gone beyond a ruling on the extreme statute before the Court. … Heavy-handed judicial intervention was difficult to justify and appears to have provoked, not resolved, conflict.” — Ruth Bader Ginsburg, Associate Justice of the U.S. Supreme Court
“In the Court’s first confrontation with the abortion issue, it laid down a set of rules for legislatures to follow. The Court decided too many issues too quickly. The Court should have allowed the democratic processes of the states to adapt and to generate sensible solutions that might not occur to a set of judges.” — Cass Sunstein, University of Chicago law professor
“Judges have no special competence, qualifications, or mandate to decide between equally compelling moral claims (as in the abortion controversy). … [C]lear governing constitutional principles … are not present [in Roe].” — Alan Dershowitz, Harvard law professor
“[O]verturning [Roe] would be the best thing that could happen to the federal judiciary. … Thirty years after Roe, the finest constitutional minds in the country still have not been able to produce a constitutional justification for striking down restrictions on early-term abortions that is substantially more convincing than Justice Harry Blackmun’s famously artless opinion itself.” — Jeffrey Rosen, legal commentator, George Washington University law professor
“Blackmun’s [Supreme Court] papers vindicate every indictment of Roe: invention, overreach, arbitrariness, textual indifference.” — William Saletan, Slate columnist, writing in Legal Affairs
“In the years since the decision an enormous body of academic literature has tried to put the right to an abortion on firmer legal ground. But thousands of pages of scholarship notwithstanding, the right to abortion remains constitutionally shaky. … [Roe] is a lousy opinion that disenfranchised millions of conservatives on an issue about which they care deeply.” — Benjamin Wittes, Brookings Institution fellow
“Although I am pro-choice, I was taught in law school, and still believe, that Roe v. Wade is a muddle of bad reasoning and an authentic example of judicial overreaching.” — Michael Kinsley, columnist, writing in the Washington Post